
LTCUSD Medium-term Trend: Bearish
Resistance: $142, $140, $138
Support: $130, $132, $134
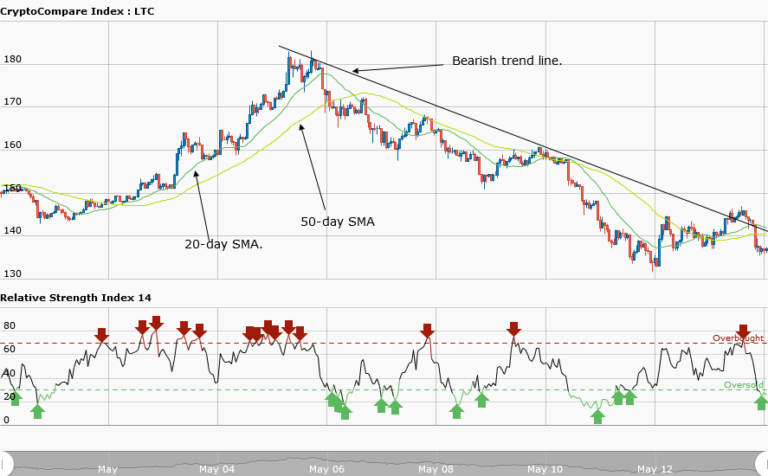
Last week, the price of Litecoin had been stable at $160, since the bearish breakout from the high of $183, on May 5th. However, last Friday Litecoin had a bearish breakout that made price to fall to the low of $143. Nevertheless, it was assumed that if the asset declined further and broke the support level at $140, the asset would reach the low of $131. The price of Litecoin is currently trading at $137.55 as of the time of writing.
However from the weekly chart we can see that the price of the asset actually declined further to the low of $133 on May 12th, and later made a bullish movement above the price level of $140. The price of the asset fluctuates now between the support level at $130 and the resistance level at $150. Meanwhile, the relative strength index period 14 indicates that price is in the bullish trend zone.
If price of the asset continues with its fall, the support level at $140 will be broken, and the price will reach the lows of $133 and $130.
LTCUSD Short-term Trend: Ranging

On the daily chart, the price of the asset is in a ranging market. At a low of $136, the price made a bullish movement to the high of $146 and commenced a range bound movement. It is likely that the price will continue its range bound movement between the levels of $136 and $146 pending a possible breakout.
The views and opinions expressed here do not reflect that of CryptoGlobe.com and do not constitute financial advice. Always do your own research.