

LTCUSD Medium-term Trend: Bearish
Resistance: $160, $155, $150
Support: $130, $135, $140
Yesterday, March 10, the LTCUSD pair was in a bullish market. The Litecoin price broke the bearish trend line thus bringing the previous downtrend to an end. Yesterday, the asset was making another attempt to break the resistance level at $160 so as to retest the $168 and $170 highs. Then Litecoin will have access to reach the $182 high. Nevertheless, the Litecoin price is currently trading at $143.08 at the time of writing.
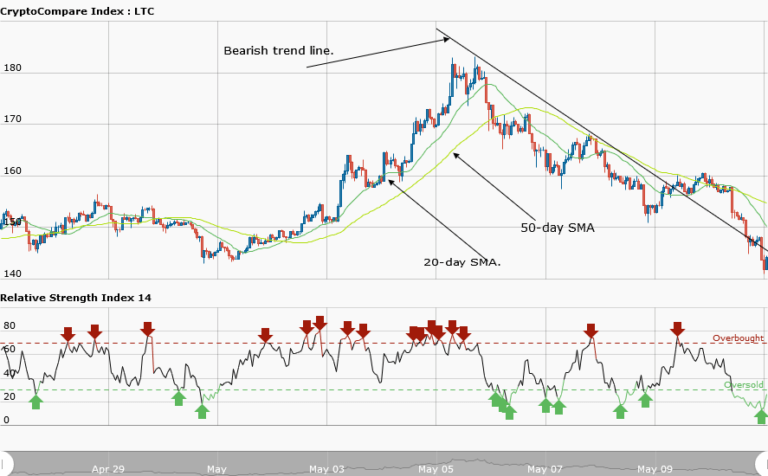
However, the weekly chart shows Litecoin in a downtrend. A bearish trend line is drawn across the price bars, showing the resistance levels where you can place short trades. A short trade could be placed as the price pulls back to touch the trend line. The 20-day moving average is below the 50-day one indicating that the price is falling.
However, if Litecoin declines at the support level, the asset price will break the support level at $140 and find support at $131. However, if the price appreciates, then it will reach the $160 high.
LTCUSD Short-term Trend: Bearish

The daily chart shows the Litecoin price in a downtrend. The asset price fell from $160 to as low as $140. If the asset continues with its downtrend, the support levels will be breached.
The views and opinions expressed here do not reflect that of CryptoGlobe.com and do not constitute financial advice. Always do your own research.


