

LTCUSD Medium-term Trend: Bullish
Resistance: $161, $160, $159
Support: $155, $156, $157
Yesterday, March 9, the LTCUSD pair broke the support level at $160, which made the price fall to $150. Even at that level, it was assumed that if the price continued to fall and the support level at $150 was broken, the asset may find support at $144. Nevertheless, Litecoin was trading at $160.13 at the time of writing.
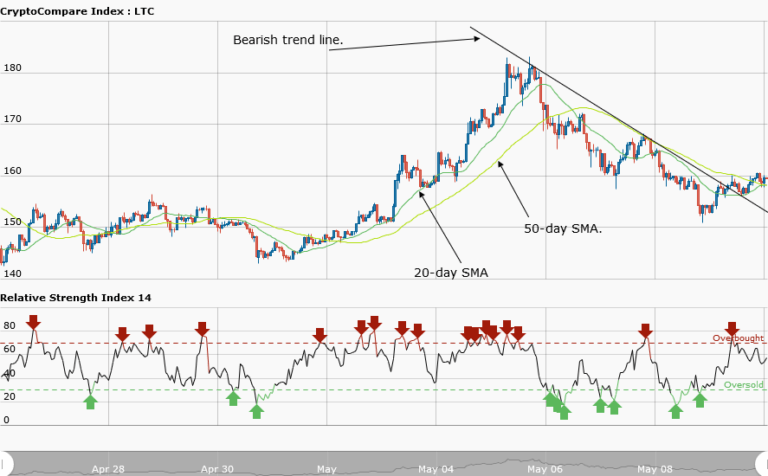
Today, the Litecoin price is rising and has broken the bearish trend line, thus bringing the previous downtrend to an end. The asset is making another attempt to break the previous support level, now a resistance level at $160. Then it will retest the resistance level at $168 which will cause the price to break the previous support of $160. Litecoin has another hurdle to cross at the resistance level at $170, before it reaches $182.
Meanwhile, the relative strength index period 14 is level 54, which indicates that the price is in the range bound movement.
LTCUSD Short-term Trend: Ranging

The daily chart shows Litecoin in a range bound movement. The ranging market on the chart is a good setup for a market strategy. The asset price is ranging between the resistance level and the support level. That is where you buy at the support level and close near the resistance zone and vice versa.
The views and opinions expressed here do not reflect that of CryptoGlobe.com and do not constitute financial advice. Always do your own research.


