
ETHUSD Long-term Trend – Bearish
Distribution territories: $1000.00, $1,100.00, $1,200.00.
Accumulation territories: $500.00, $400.00, $300.00.
There was a slight ranging move on the ETH/USD pair, between April 29 and May 1. A few hours later on May 1, the trading pair started becoming highly volatile, leading the bulls to breach past the last week’s immediate distribution territory of $700.00. The bulls strived to extend the northward move up to the point of touching the distribution territory of $800.00. At present, price has been trading between the distribution territories of $700.00 and $800.00.

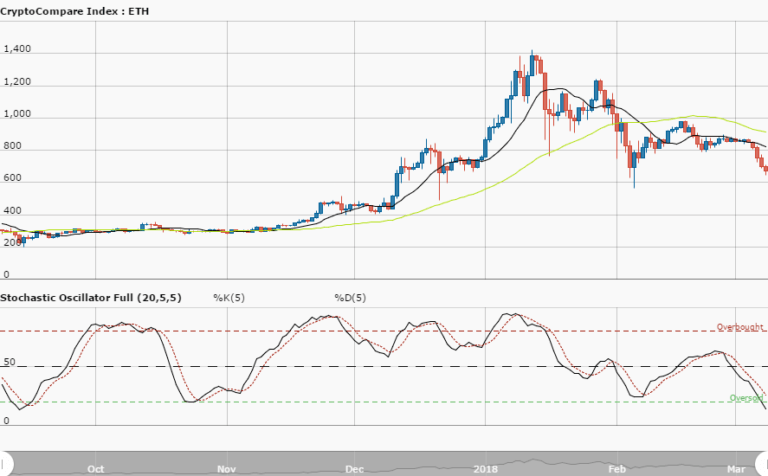
The 13-day SMA is above the 50-day SMA, and the price has been trading along the trend of the 13-day SMA. This pair has had every possible status of changing from the current long-term bearish trend.
Stochastic Oscillators are now moving in the overbought zone, and still indicating the strength of the bulls. There is strong probable indication that the bulls are now getting stronger against the bears. At this point in time, there can be a sudden reversal from the upward movement, but it may not be for long.
Now, the verdict for the investors is that they can look out for a reversal from a bearish move and enter a long trade. As for the traders, they can also enter the market by entering long positions with proper money management that involves the use of either trailing stop loss or automatic trailing stop loss.
The views and opinions expressed here do not reflect that of CryptoGlobe.com and do not constitute financial advice. Always do your own research


