

ETHUSD Medium-term Trend: Bearish
Resistance: $760, $750, $740
Support: $700, $710, $720
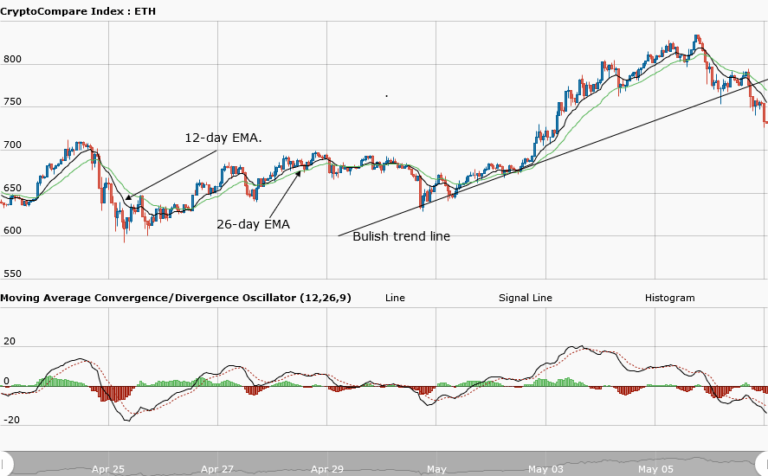
Last week the price of Ethereum was bullish and at the same range-bound in its movement. The price of the asset had been range-bound between the levels of $650 and $700 but the resistance level at $700 had been broken. The MACD line and the signal line were above the zero line indicating a bullish trend. Presently, Ethereum is above the psychological level of $700. Today, the asset is currently trading at $731.18 as at the time of writing.
However, the price of Ethereum has broken the bullish trend line indicating that the trend has ended. The price of the asset broke the trend line and closed on the opposite of the trend line; thus completing the action of reversal of trend. Also, the 12-day EMA and 26-day EMA are above the falling price bars indicating that Ethereum has a bearish outlook. Above all, the MACD line and the signal line are below the zero line which completes the bearish outlook.
ETHUSD Short-term trend: Bearish

In the daily chart, price of Ethereum is in a bearish outlook. The price of the asset becomes weak against the US dollar. The asset was ranging at a price of $790 but later fell to the low of $730.
The views and opinions expressed here do not reflect that of CryptoGlobe.com and do not constitute financial advice. Always do your own research.


