

ETHUSD Medium-term Trend: Bullish
Resistance: $610, $600, $590
Support: $550, $560, $570
On 27 May, the ETHUSD pair was in a bearish market. The asset fell to $503 and the price was sustained above $500 for days in a range-bound movement. Meanwhile, the MACD line and the signal line were below the zero line, indicating a sell signal. Ethereum was trading at $562.70 at the time of writing. The weekly chart shows that the Ethereum price made a bullish movement above $550.
Also, the asset attempts to establish itself above that level. However, if the bulls sustain that level, traders can initiate long trades above it and a stop loss can be placed at $500. Also, the chart shows that the MACD line and the signal line are above the zero line, indicating a buy signal.
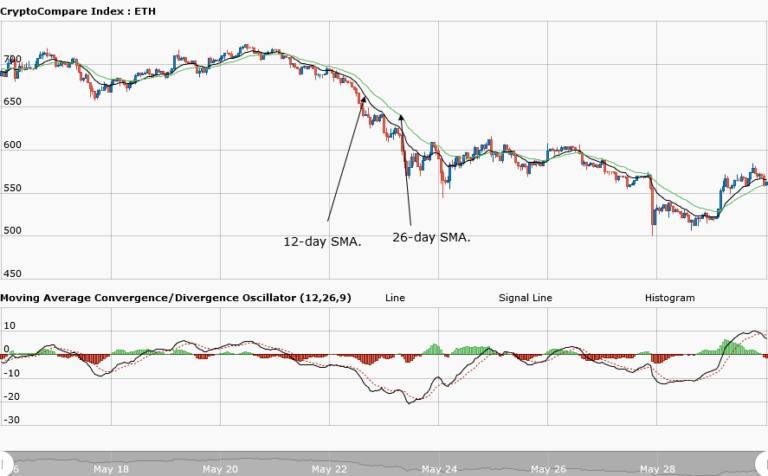
The Ethereum price is above the 12-day and 26-day EMA, indicating that the bullish trend is ongoing. In addition, the negative histogram (symbol) turned to positive because the MACD line is above the signal line, indicating a buy signal .
ETHUSD Short-term trend: Bearish

The daily chart shows the Ethereum price in a bearish market. The MACD line and the signal line are below the zero line, also indicating a sell signal. The chart shows that the price rose from $520 to $580. Partial profits would have been made if long trades had been initiated, as the price consolidated at $520 and exited at $580.
The views and opinions expressed here do not reflect that of CryptoGlobe.com and do not constitute financial advice. Always do your own research.


