

ETHUSD Medium-term Trend: Bearish
Resistance: $570, $565, $560
Support: $540, $545, $550
Last week, the price of Ethereum had a bearish outlook on some days of the week. The price fell from the high of $720 to the low of $596.10. The MACD line and the signal line indicated a sell signal on some days of the week. However, the bearish pressure of the asset is ongoing. The price of Ethereum is currently trading at $553.99 as at the time of writing.
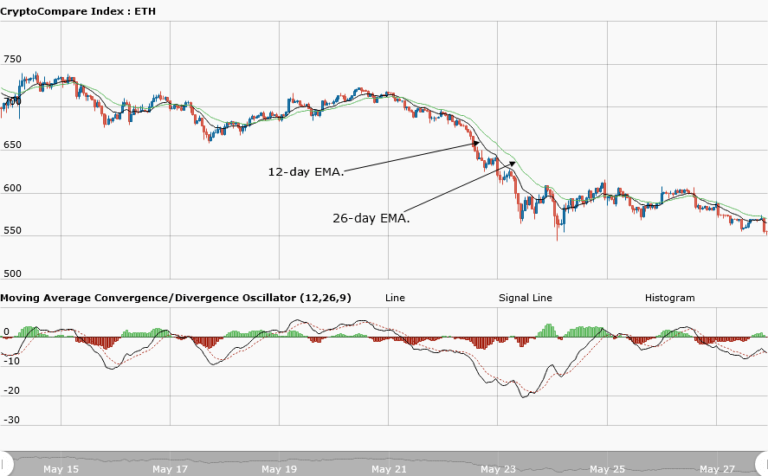
From the weekly chart, the price of Ethereum fell again from the high of $596 to the low of $550. The price of the asset is likely to fall to the lows of $500 and $400 because the asset may face resistance at those levels. Meanwhile, the MACD line and the signal line are below the zero line indicating a sell signal.The 12-day EMA and 26-day EMA are above the price of Ethereum indicating that the bearish pressure is ongoing.
ETHUSD Short-term trend: Bearish

On the daily chart, the price of Ethereum has a bearish outlook. The MACD line and the signal line indicate a serious sell signal. Since the bearish pressure is ongoing all long positions would be suspended.
The views and opinions expressed here do not reflect that of CryptoGlobe.com and do not constitute financial advice. Always do your own research.


