

ETHUSD Medium-term Trend: Bearish
Resistance: $620, $610, $600
Support: $560, $570, $580
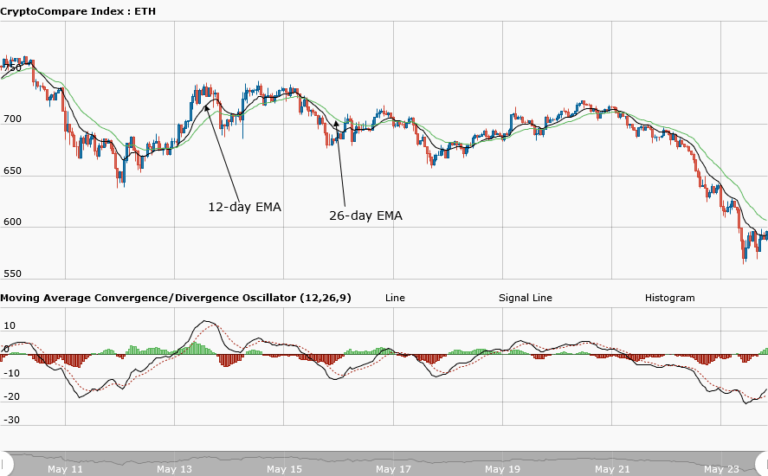
Yesterday, May 23, the ETHUSD pair entered the second day of its downtrend. Ethereum’s price broke the support level at $660. The MACD line and the signal line showed a sell signal, whereas the 12-day EMA and the 26-day EMA, which were above the price of Ethereum, indicated that the bearish trend was ongoing. Ethereum is currently trading at $577.10. Today, the price of Ethereum has entered the third day of its bearish trend.
Ethereum fell to a low of $570, in which the bears were resisted twice as the price was ranging at that level. If that level is resisted on more than three occasions, it becomes a strong support and the price may likely hold. However, if the downtrend continues, the asset may fall to a low of $500. The MACD line and the signal line are still below the zero-line, indicating a sell signal.
The 12-day EMA and the 26-day EMA, which are above the price of Ethereum, are indicating that a bearish trend is ongoing
ETHUSD Short-term trend: Ranging

On the daily chart, price of Ethereum fell from a high of $640 to a low of $570. The bears were resisted twice, and the asset went into a range bound movement.
The views and opinions expressed here do not reflect that of CryptoGlobe.com and do not constitute financial advice. Always do your own research.


