

ETHUSD Medium-term Trend: Bearish
Resistance: $700, $695, $690
Support: $670, $675, $680
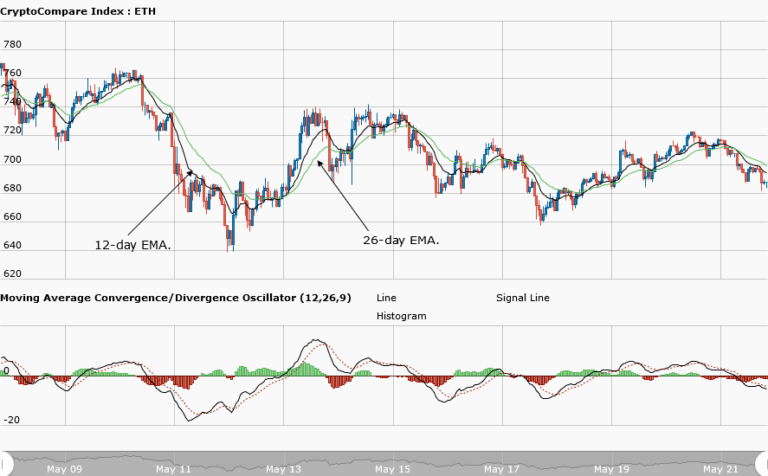
Yesterday, May 21st the price of Ethereum was in a bullish market. The price of the asset rose to the high of $720 and made a pullback to the low of $713.39. However, it was assumed that the price could only reach the highs of $750 and $800 if the resistance level at $720 was broken. Yesterday, the MACD line and the signal line were above the zero line and the tools indicated a buy signal.
The price of the asset was above the 12-day EMA and 26-day EMA indicated that the bullish trend was ongoing. Ethereum is currently trading at $685.22 at the time of writing. From the weekly chart, the price of Ethereum has fallen because of the resistance at $720. The MACD line and the signal line are now below the zero line indicating a sell signal.
We have also 12-day EMA and 26-day EMA which are above the price of Ethereum indicating that the bearish trend is ongoing. If the price of the asset continues its fall, it may face resistance at the support level of $660. The asset may commence a range bound movement if resisted at the support level of $660.
ETHUSD Short-term trend: Bearish

On the daily chart, the price of Ethereum is falling as a result of the resistance at $715. The asset has fallen to the low of $685.
The views and opinions expressed here do not reflect that of CryptoGlobe.com and do not constitute financial advice. Always do your own research.


