

ETHUSD Medium-term Trend: Ranging
Resistance: $690, $685, $680
Support: $660, $665, $670
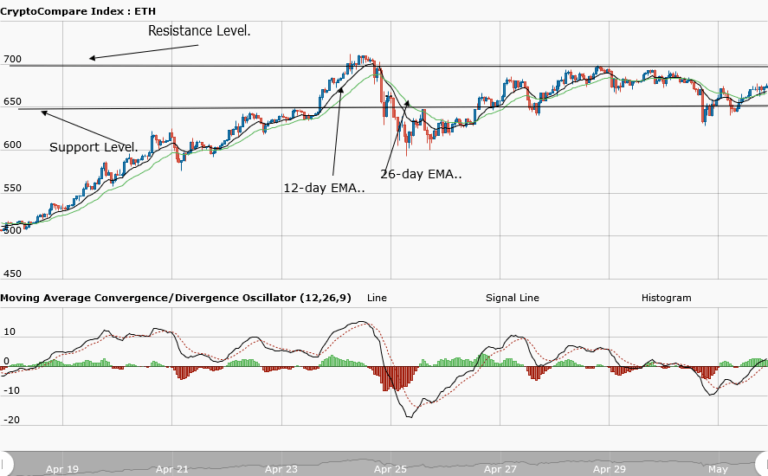
Yesterday, May 1, Ethereum price was bearish as indicated by the MACD line and the price action. The price action showed that Ethereum broke the bullish trend line and the candlestick closed on the opposite of the trend line. The ETHUSD pair was trading at $674.92 at the time of writing. However, the weekly chart shows that Ethereum price is ranging between the resistance level at $700 and the support level of $650.
After testing the support level twice without success, the bulls are pushing the price to the previous level high. The MACD line and the signal line are below the zero line but the price is rising in a ranging market.
ETHUSD Short-term trend: Ranging

In the daily chart, Ethereum price is in a ranging market. The price action is evenly apart between the resistance level and the support level. In such setup, you can adopt a range-bound strategy to trade the key levels. However, this is not possible because of the recent price action. The price is ranging at the resistance level for a possible breakout and, as such, the direction is not certain.
The views and opinions expressed here do not reflect that of CryptoGlobe.com and do not constitute financial advice. Always do your own research.


