

ETHUSD Medium-term Trend: Bearish
Resistance: $710, $700, $690
Support: $650, $660, $670
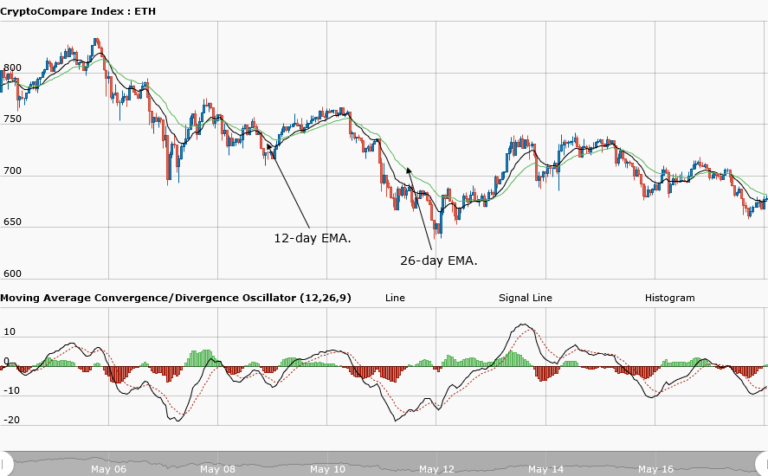
Ethereum price was trading below the $700 level yesterday. However, the MACD and the signal lines were above the zero line, indicating a buy signal. In the same vein, the MACD histogram was positive because the MACD line was above the signal line, indicating that the price was rising. Ethereum was trading at $678.03 at the time of writing. However, the weekly chart shows Ethereum has a bearish outlook.
The MACD line and the signal line are below the zero line, indicating a sell signal. Also, the MACD line crosses below the signal line, indicating that Ethereum price is falling. The Ethereum price bars are below the 12-day and 26-EMA, indicating a downtrend. If the downward trend continues and the price breaks the support level at $650, Ethereum will fall to $600.
ETHUSD Short-term trend: Bullish

The daily chart shows that Ethereum was ranging at $700 and later fell to $660. The asset is now making a bullish movement on the upside. On the chart, the MACD line and the signal line are above the zero line, indicating a sell signal.
The views and opinions expressed here do not reflect that of CryptoGlobe.com and do not constitute financial advice. Always do your own research.


