

ETHUSD Medium-term Trend: Bearish
Resistance: $720, $720, $700
Support: $660, $670, $680
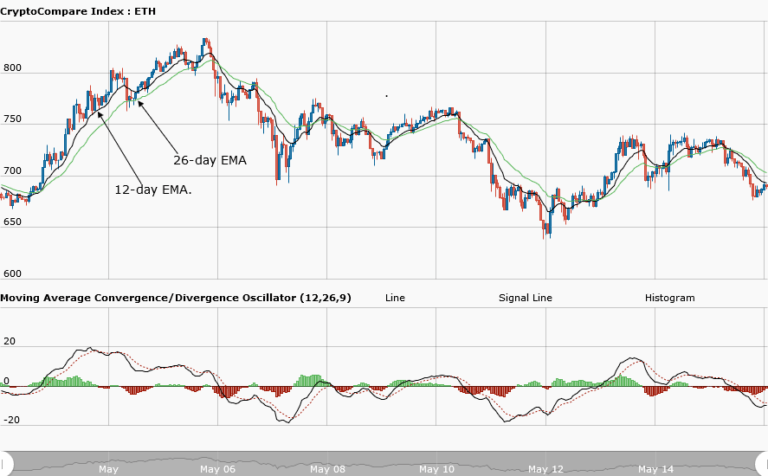
Yesterday, May 15, the ETHUSD pair was ranging from the resistance level at $750 to the support level at $700. The MACD line and the signal line were above the zero line and it indicated a buy signal. The price bars were above the 12-day and the 26-day EMA indicating that the bullish trend was ongoing. Today, the Ethereum price fell below the support level but it was trading at $685.52 at the time of writing.
From the weekly chart, the asset is approaching the previous low of $671. If the downtrend continues, the asset will find support at $650. However, the MACD line and the signal line are now below the zero line indicating a sell signal. The price bars are below the 12-day and 26-day EMA, indicating that the bearish trend is ongoing.
ETHUSD Short-term trend: Bearish

The daily chart shows Ethereum price in a bearish market. The asset is in a smooth downtrend and the price will make a series of lower highs and lower lows. A trend line is drawn showing the resistance levels where traders can place short trades. The resistance levels are created when the price pulled back and touched the trend line.
The views and opinions expressed here do not reflect that of CryptoGlobe.com and do not constitute financial advice. Always do your own research.


