

ETHUSD Medium-term Trend: Ranging
Resistance: $760, $750, $740
Support: $700, $710, $720
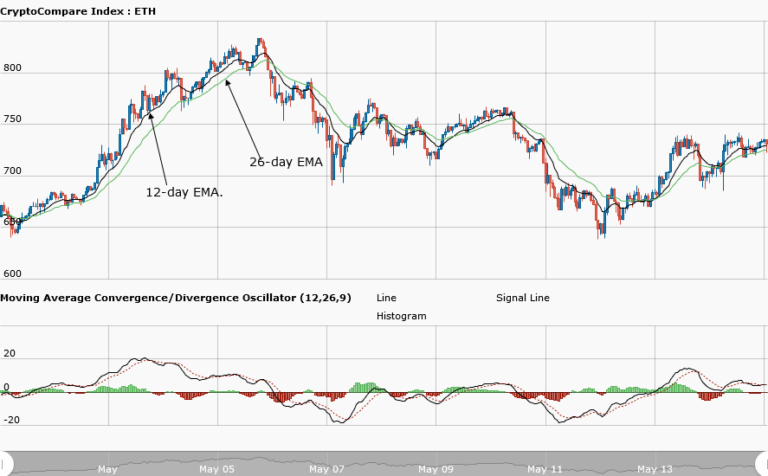
Yesterday, May 14th the overall trend of Ethereum was bearish. The price of the asset had fallen from the highs of $830, $767 and $735 as per the bearish trend line. However, at the time of writing, the MACD line and the signal line were above the zero line indicating a buy signal. The price bars of Ethereum were above the 12-day EMA and 26-day EMA indicating that the bullish trend is ongoing.
It was assumed that if the support level was broken, Ethereum would find support at $672. Today, Ethereum is currently trading at $723.67 at the time of writing. From the weekly chart, the price of the asset is above the $700 level. The asset is ranging from the support level at $700 to the resistance level at $750. Today the indicators are showing bullish signals.The MACD line and the signal line are above the zero line indicating a buy signal.
The price bars of Ethereum were above the 12-day EMA and 26-day EMA indicating that the bullish trend is ongoing. Therefore the price is expected to test the resistance level at $750 and reach further highs.
ETHUSD Short-term trend: Ranging

On the daily chart, the price of Ethereum is in a ranging market. At the levels of $690 and $700, the price of Ethereum was ranging. Then it had a bullish movement which took it to the high of $740. At the high of $740, it resumed its range bound movement.
The views and opinions expressed here do not reflect that of CryptoGlobe.com and do not constitute financial advice. Always do your own research.


