

ETHUSD Medium-term Trend: Bearish
Resistance: $720, $710, $700
Support: $660, $670, $680
Yesterday, the ETHUSD pair was in a bullish market because price has broken the bearish trend line. Also, the MACD line and the signal line are above the zero line indicating a buy signal. Another signal was that the negative histogram has turned from a negative to a positive histogram. Yesterday, we were expecting that Ethereum would retest the high of $792 which was the price it reached before it fell to the low of $700.
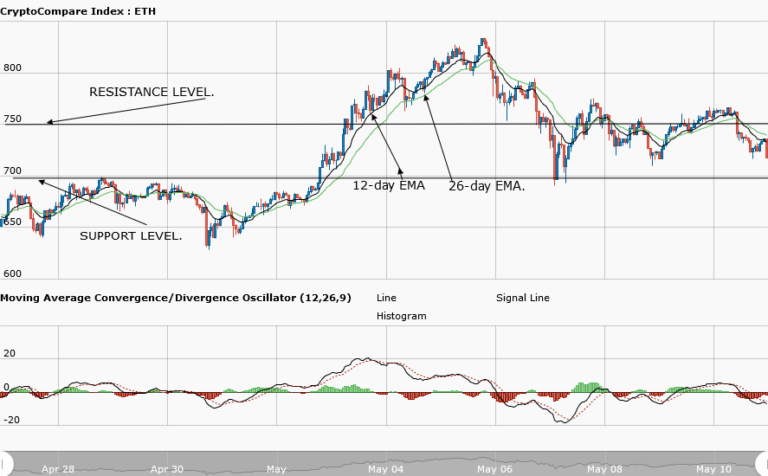
Today, price of Ethereum is currently trading at $711.97 as at the time of writing. However, from the weekly chart, the asset has fallen into the range bound zone, between the resistance level at $750 and the support level at $700. If price of the asset further declines, it will break the support level at $700 and find support at $674. But if price breaks the resistance level at $750, Ethereum will reach the high of $768.
However, the MACD line and the signal line are below the zero line indicating a sell signal. The histogram has turned from positive to negative histogram because the asset is bearish.
ETHUSD Short-term trend: Bearish

In the daily chart, price of Ethereum is in a bearish outlook. The 12-day EMA and 26-day EMA are above the price bars indicating that price of Ethereum are falling. Support level of $670 will likely lead to a bounce, however, a trader should avoid trying to catch falling knives.
The views and opinions expressed here do not reflect that of CryptoGlobe.com and do not constitute financial advice. Always do your own research.


