

ETHUSD Medium-term Trend: Bearish
Resistance: $700 $690, $680
Support: $620, $630, $640
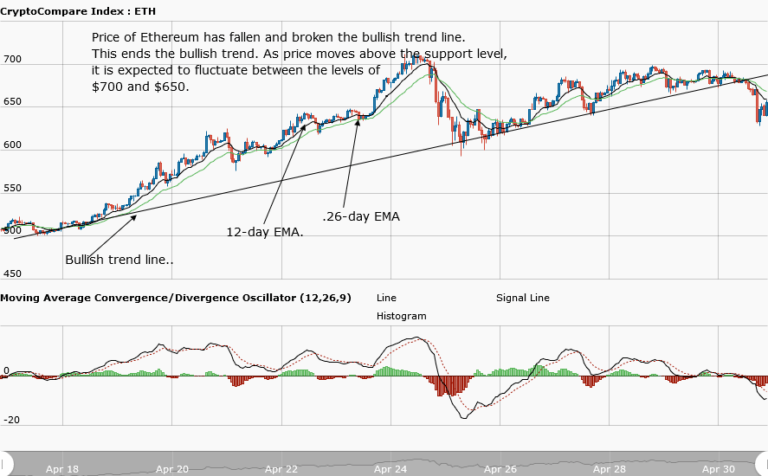
On April 30, price of Ethereum was in a bullish market attempting to reach the high of $700 mark. The MACD line and the signal line were above the zero line; whereas the price bars were above the 12-day EMA and the 26-day EMA. Today, price of Ethereum has fallen to $653.26 price level. However, from the weekly chart, Ethereum fell below the support level at $650 and there were price corrections.
The MACD line and the signal line are below the zero line signaling a bearish outlook. Another aspect is that the falling price broke the bullish trend line and candlestick closed on the opposite of the trend line. This signals the end of the bullish trend. Traders should close all their long trades in anticipation of the new trend. Price of Ethereum corrected itself by trading above the support level at $650.
Price is expected to fluctuate in between the resistance level at $700 and the support level at $650.
ETHUSD Short-term trend: Bearish

In the daily chart, Ethereum was ranging at a price of $680 and later fell to the low of $630. The price of the asset corrected itself by making a bullish movement to the high of $650.
The views and opinions expressed here do not reflect that of CryptoGlobe.com and do not constitute financial advice. Always do your own research.


