

EOS USD Medium-term Trend: Bearish
Supply levels: $12.6, $12.4, $12.2
Demand levels: $11.4, $11.6, $11.8
Last week the price of EOS had a bearish outlook. The asset was range bound between the levels of $15 and $12. However, the bearish breakout made the price to fall to the low of $10.71. The bearish trend was assumed to have ended because price of the asset broke the bearish trend line and the candlestick closed on the opposite of the trend line. Today, the asset has fallen to the low of $11.93 at the time of writing.
From the weekly chart, the price of EOS reached the high of $13 and fell to break the support level at $12. The relative strength index period 14 is level 34 indicates that the market is oversold suggesting bulls will take control of the market. THe price of EOS will still rally even at the oversold market condition. In the other words, the price will fall to the low of $ 10.71 because the bearish pressure is not over.
EOSUSD Short-term Trend: Bearish

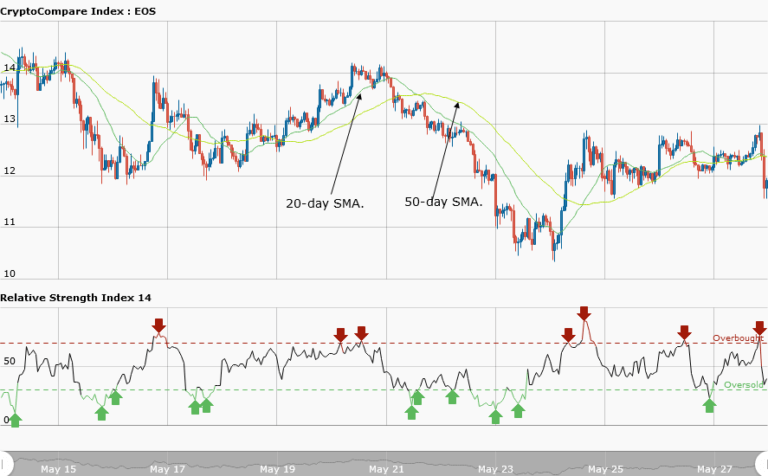
On the daily chart, the price of EOS is in a bearish outlook. The price of the asset was range bound at the price of $12. The bulls and the bears were in strong contention until the bears took the price to the low of $11.4. Although the price of the asset is ranging, it is assumed the asset is likely to fall to the previous low if the bears are still in control.
The views and opinions expressed here do not reflect that of CryptoGlobe.com and do not constitute financial advice. Always do your own research.


