

EOS USD Medium-term Trend: Bearish
Supply levels: $13.0, $12.5, $12.0
Demand levels: $10.0, $10.5, $11.0
Yesterday, May 24, the price of EOS got out of the range-bound zone of $15 and $12. The asset fell to a low of $10.50. At the support level of $10.50, there was some respite from the bearish pressure, and traders were advised not to embark on any long positions until the bearish pressure had ended. Meanwhile, the EOSUSD pair is currently trading at $12.36.
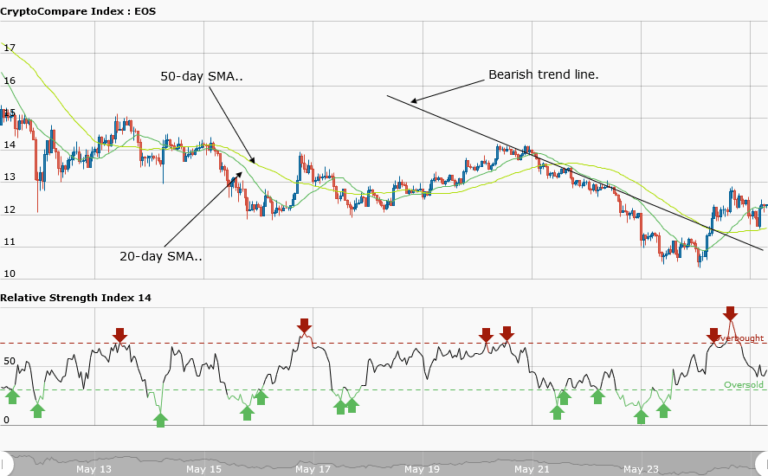
Today, from the weekly chart, EOS’ price fell to the low of $10, and made a pullback to over $11. The asset is making a bullish movement to a high of $12. The EOSUSD pair has also broken the bearish trend line and the candlestick closed on the opposite of the trend line. This implies that the bearish trend is over. Traders can initiate long trades at a price above $11 and place a stop loss below $10.50.
The relative strength index period 14 is level 41 indicates that price of the asset is in the range bound zone.
EOSUSD Short-term Trend: Ranging

On the daily chart, the price of EOS is in a range bound movement. At a price of $12, the asset was ranging horizontally. Later, it rose to the high of $12.5 to resume its range bound movement.
The views and opinions expressed here do not reflect that of CryptoGlobe.com and do not constitute financial advice. Always do your own research.


