

EOS USD Medium-term Trend: Bearish
Supply levels: $12.5, $12.0, $11.5
Demand levels: $9.50 $10.0, $10.5
The price of EOS is in a downtrend while it was previously in a range bound movement. The asset had been ranging between the levels of $15 and $12. Yesterday, the support level at $12 was broken. Traders were previously advised that, if a bearish breakout occurred, a short trade should be initiated. At the same time, a stop loss at $11 should be placed. Also, it was stated that if the downtrend continued, the asset would fall to a low of $11.
EOS is currently trading at $12.06. However, from the weekly chart, price of EOS has fallen to a low of $10.50. Traders may consider suspending long positions until the price decline is over. At the support level of $10.50, the asset has resisted three times. The price of the asset was out of the range bound zone of $15 and $12.
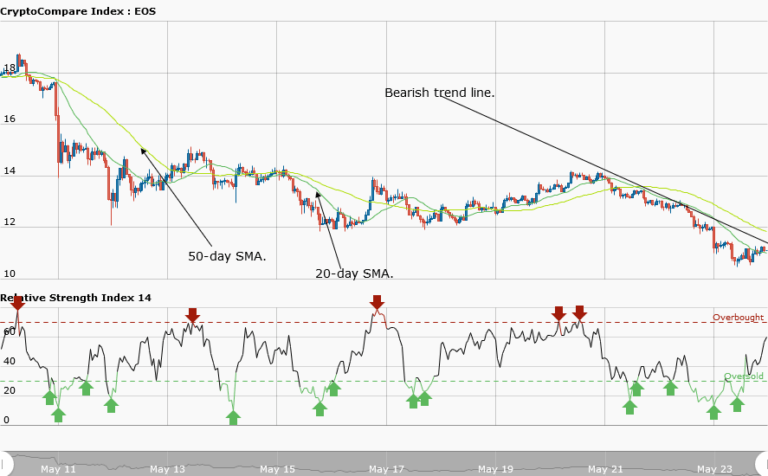
Meanwhile, the RSI 14 is at 61, which indicates that the price is in a bullish trend zone. If the asset rises it may face resistance at a price of $12.
EOSUSD Short-term Trend: Ranging

On the daily chart, EOS is in a range bound movement. At $11, the asset was ranging but fell to a low of $10.50. At the support of $10.50, it resumed its range bound movement.
The views and opinions expressed here do not reflect that of CryptoGlobe.com and do not constitute financial advice. Always do your own research.


