

EOS USD Medium-term Trend: Ranging
Supply levels: $14.5, $14.0, $13.5
Demand levels: $11.5, $12, $12.5
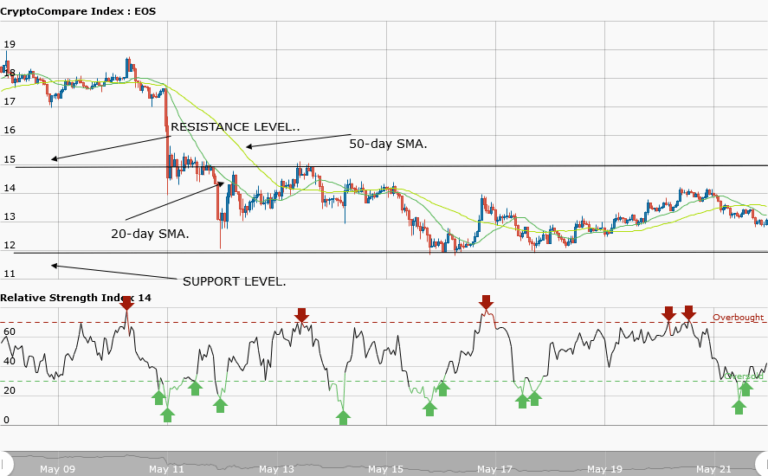
Yesterday, May 21, the EOSUSD pair was still in its range bound zone of trading from the support level at $12 to the resistance level at $15. Price of the asset could not break the support level which had been tested for about five times. This makes it a strong support level for trading and any breakout to be powerful. Yesterday, the asset faced resistance at a price of $14 which compelled it to continue its range bound movement.
Today, the asset is currently trading at $13.05 as at the time of writing. From the weekly chart, price of EOS was resisted at a price $14 and was unable to break it. That was the reason for its fall to the lows of $13.05. However, if price falls to the low of $12, a long trade should be initiated and a stop loss is placed at a price of $11. Price of the asset will continue its range bound movement if neither the Bulls nor the Bears fail to take charge.
EOSUSD Short-term Trend: Bearish

On the daily chart, price of EOS fell from the high of $14 to the low of $13. The 20-day moving average and 50-day moving average are trending southward.
The views and opinions expressed here do not reflect that of CryptoGlobe.com and do not constitute financial advice. Always do your own research.
.


