
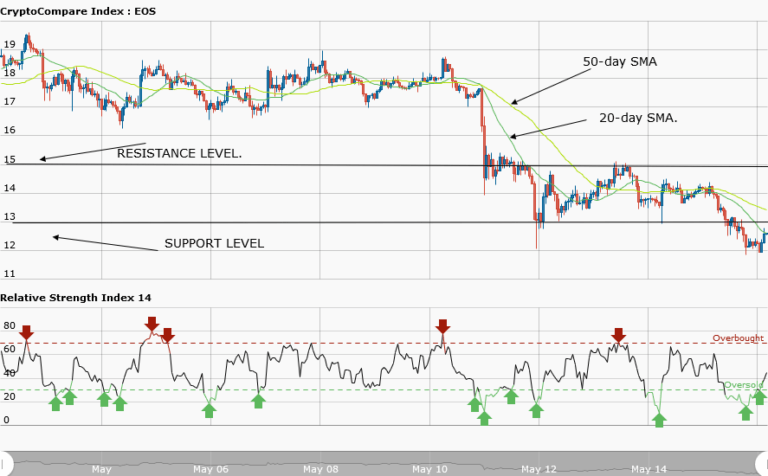

EOS USD Medium-term Trend: Bearish
Supply levels: $17, $16, $15
Demand levels: $11, $12, $13
Yesterday, March 15, EOS price was ranging from the support level at $13 to the resistance level at $15. The asset was expected to have a breakout at any time and at any level. However, while in a ranging market, if the price breaks at the support level, then a short trade should be considered. On the other hand, if the price breaks at the resistance level, then your choice should be a long trade. Today, the asset was trading at $12.18 at the time of writing.
Nevertheless, the weekly chart shows that EOS price broke the support level at $13 and fell to $12. If traders had place sell stops at the support level or below the market price, they would have taken partial profits yesterday. Meanwhile, the relative strength index period 14 is level 16 indicating that the market is oversold and suggesting the bulls will take control of the market.
EOSUSD Short-term Trend: Bearish

On the daily chart, the EOS price has a bearish outlook. The price fell from $14 to $12.5 and began a range bound movement. Later, it fell to $12 and resumed its range bound movement.
The views and opinions expressed here do not reflect that of CryptoGlobe.com and do not constitute financial advice. Always do your own research.


