

EOS USD Medium-term Trend: Ranging
Supply levels: $17, $16, $15
Demand levels: $11, $12, $13
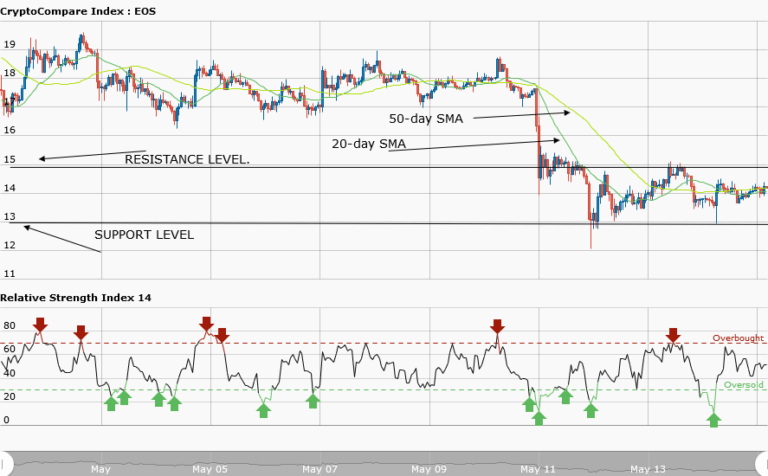
Yesterday, May 14, the EOSUSD pair was in a downtrend. A trend line was drawn to show the resistance levels of the price where traders could possibly place their short trades. Traders were advised that when the price pulled back and it touched the trend line, that was a signal to short their trades. The relative strength index showed yesterday that price of EOS was oversold suggesting Bulls will take control of the market.
The price of the asset is currently trading at $14.04 as at the time of writing. Looking at the weekly chart, the price of EOS is now ranging between the support level at $13 and the resistance level at $15. If the price breaks the support level, a short order should be initiated and a stop loss above the support level.
Conversely, if the price breaks the resistance level, a long order should be initiated, and a stop loss below the resistance level. Meanwhile, the relative strength index period 14 is level 41 indicating that the price is in the range bound zone.
EOSUSD Short-term Trend: Ranging

On the daily chart, the price of EOS is in a ranging market. At a price of $13.5, the asset was ranging and later fell to the low of $13.0. Then it had a bullish movement and rose to the high of $14.5 to resume its range bound movement.
The views and opinions expressed here do not reflect that of CryptoGlobe.com and do not constitute financial advice. Always do your own research.


