

EOS USD Medium-term Trend: Bearish
Supply levels: $15, $14.5, $14
Demand levels: $12, $12.5, $13
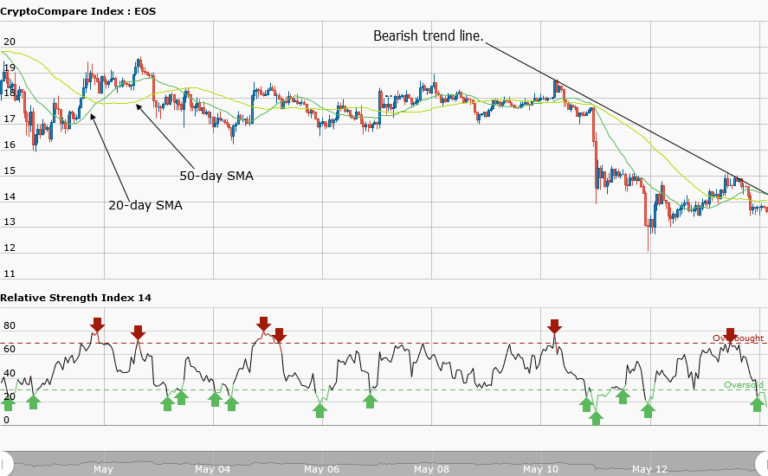
Last week, the price of EOSUSD pair was ranging between the resistance level at $20 and the support level at $16. However, the price of the asset broke the support level last week at $16 on Friday 11th. Meanwhile, the asset is currently trading at $13.76 as of the time of writing. Today, the EOSUSD pair is still in a bearish market. A bearish trend line is drawn showing the resistance levels where traders can place short trades.
Traders can place short trades if the price pulls back and touches the trend line. Meanwhile, the 20-day moving average and 50-day moving average are trending southward. The relative strength index period 14 is level 18 which indicates that the market is oversold suggesting that Bulls will take control of the market.
EOS USD Short-term Trend: Ranging

On the daily chart, theprice of EOS is in a ranging market. At a price of $14.0, EOS was ranging before it rose to $15. At the price of $15.0, EOS was ranging between the levels of $15.0 and $14.5. The relative strength index period 14 is level 41 which indicates that the price is in the range bound zone.
The views and opinions expressed here do not reflect that of CryptoGlobe.com and do not constitute financial advice. Always do your own research.


