

EOS USD Medium-term Trend: Ranging
Supply levels: $18.5, $18.0, $17.5
Demand levels: $15.5, $16.0, $16.5
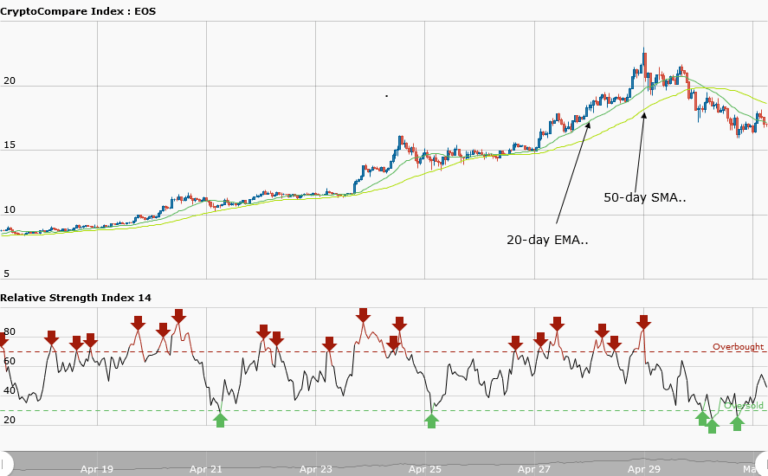
The EOSUSD pair was in a bullish market in its early trading days. The 20-day moving average is above the 50-day one, indicating that the EOS price is rising. This bullish market ended at the close of business on April 29, 2018. Thereafter, the price fell to $20 and started a range-bound movement. The price is currently trading at $16.87.
However, the weekly chart shows that the price fell from $20 to $16.8 and started a range bound movement. Presently, the asset will be fluctuating between the $20 and $15 levels. The relative strength index period 14 is level 44, which indicates that the price is in the range bound zone.
EOS USD Short-term Trend: Ranging

The daily chart shows EOS is in a ranging market. At $18.5, the asset price was fluctuating horizontally. Later, it fell to $16.0 and at $16.5, it started another range-bound movement and soared to $18.0. The EOSUSD pair has a choppy price action making it not tradable. Meanwhile, the relative strength index period 14 is level 63, which indicates that the asset price is in a bullish trend zone.
The views and opinions expressed here do not reflect that of CryptoGlobe.com and do not constitute financial advice. Always do your own research


