

ADAUSD Medium-term Trend: Ranging
Supply zones: $0.4000, $0.4200, $0.4400
Demand zones: $0.1800, $0.1600, $0.1400
Cardano continues ranging in the medium-term. The $0.3200 critical demand zone was the centre of activities for both the bulls and the bears. As analyzed yesterday – this zone will determine the fate of Cardano and we can see a lot of reactions here. The bears broke the demand zone and entered the $0.2900 area. Nevertheless, the bulls arrived strongly and pushed the price up – closing the candle in a hammer. The activities at this demand zone created double bottom formation as clearly seen from the chart. The bulls’ pressure was increased and the upward push continues until price was pushed to the $0.3443 supply area. The repeat of May 1st may likely hold as the bulls pressure increase. The daily candle opened bullish and above the 50 exponential moving average, this indicates thatmore buyers are in the market. It thus implies that in the ranging scenario buying is favored.
ADAUSD Short-term Trend: Ranging

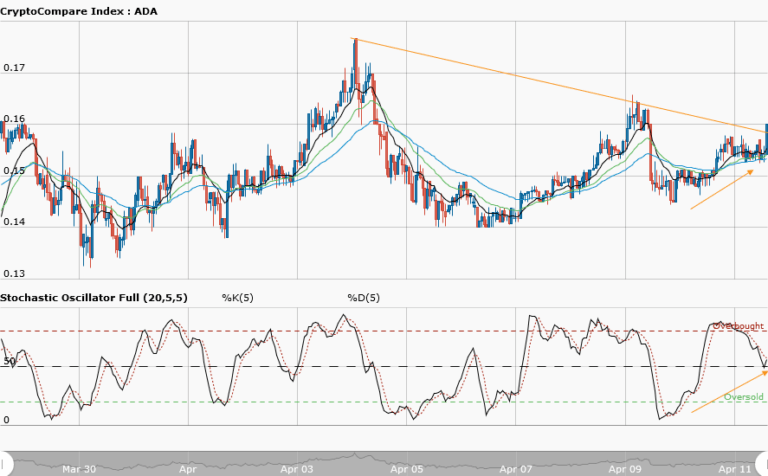
The ranging scenario continues in the short-term for Cardano. The break of the $0.3200 critical zone was made possible by the bears’ pressure but the momentum was lost. The Bulls’ came back and drove the price past the $0.3200 zone, closing the day high in the $0.3300 supply area. The bulls continue their comeback with the price pushed to the $0.3450 supply zone. The daily candle opens bullish at $0.3266. The stochastic oscillator is moving away from the oversold region at 39 percent. This implies that momentum to the upside will be seen in the short-term within the range.


