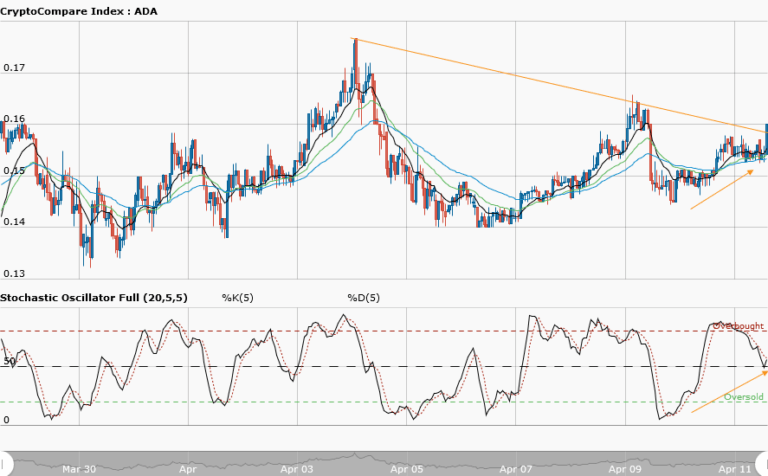
ADAUSD Medium-term Trend: Ranging
Supply zones: $0.3800, $0.4000, $0.4200
Demand zones: $0.2000, $0.1800, $0.1600
Cardano returns ranging in the medium-term. The bulls’ pressure faded away and the bears broke the channel as can be seen from the chart. A critical look justifies the breakdown as it became the fourth time the price touches the lower channel – hence the breakdown.
The bears pushed the price to the $0.3400 demand area before another effort by the bulls was rejected at the $0.3600 supply area. This was a retest of the lower channel by the bulls, thereafter the bears arrived massively and pushed the price down to the $0.3200 critical demand area.
Cardano is trapped in a range now. Patience is key to trading the pair. As the chart shows that on May 1st, Cardano found itself at this critical demand area, and the result was the bullish comeback that drove the price to the $0.3800 supply area. Currently it is at the same area.
Traders should either wait for a bullish candles formation and stochastic oscillator signal pointing upwards if a repeat of May 1st is to occur or a breakdown from the critical area before taking a position.
ADAUSD Short-term Trend: Ranging
Cardano continues ranging in the short-term. The bullish grip of the market was lost and the bears set in to push Cardano into the range. The double top formation at the $0.3500 supply area gave the bears power to push price to the $0.3200 demand area. We can see a lot of reaction at this zone. This is a critical zone because whatever happens here may likely set the pace for Cardano in the short-term.
Traders should be patient trading and hold on for either a breakdown from the lower price range ($0.3200) then retest before going south, or a breakout from the upper range ($0.3500) and then retest before going north.
The views and opinions expressed here do not reflect that of CryptoGlobe.com and do not constitute financial advice. Always do your own research.


