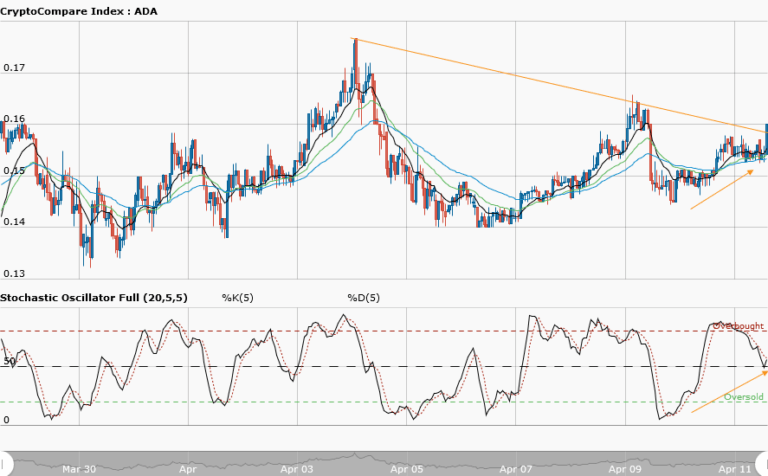
ADAUSD Medium-term Trend: Bullish
Supply zones: $0.3000, $0.3200, $0.3400
Demand zones: $0.2000, $0.1500, $0.1000
The bullish trend resumes in Cardano in the medium-term. The bearish run that pushed price down to the $0.2300 demand area was lost on 18th May. The bulls return to the market was seen with a push to the $0.2500 supply area. It was rejected for a further upward push as the bears push price back to the $0.2300 demand area. You can see from the upward trendline that each time the bears pushed price to the trendline an upward bounce is made by the bulls. On 20th May the price above the three moving averages crossover to the supply zone at $0.2600.
The exponential moving averages are fanned apart which connote strength in the context of the trend, in this case, the uptrend. Stochastic oscillator is at 71 percent with signal pointing up. This suggests upward momentum and more buying pressure. The bulls takeover of the market ends the bears’ dominance and the $0.2800 supply zone is imminent.
ADAUSD Short-term Trend: Bullish
Cardano is bullish in the short-term. The bears’ supremacy over bulls was terminated at the $0.2300 demand area as they fail to push price further down. The bulls succeeded in pushing price up to the $0.2400 supply zone and further high to $0.2600 supply zone. A minor pullback to the $0.2500 demand zone occurred but the bulls took it as an opportunity for another comeback and took price further up. The bulls are back as you can see price is forming higher highs and higher lows that are common with uptrend scenario.
The views and opinions expressed here do not reflect that of CryptoGlobe.com and do not constitute financial advice. Always do your own research


