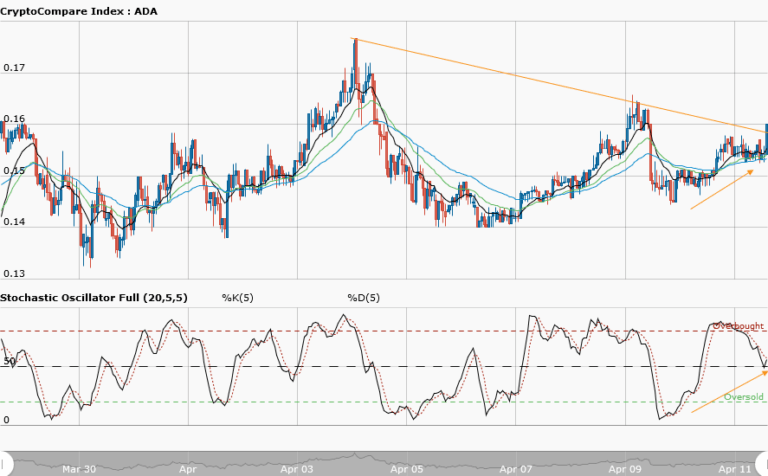
ADAUSD Medium-term Trend: Bearish
Supply zones: $0.3500, $0.4000, $0.4500
Demand zones: $0.2000, $0.1500, $0.1000
Cardano‘s bearish trend continues in the medium-term. The bears’ momentum increased following the bulls’ inability to push the price past the $0.2515 supply area. This led to the price retesting the $0.2400 demand area and breaking it this time around. This was the fourth touch on this area, hence the break and further push down to the $0.2300 fresh demand area. The price is below the moving averages crossover which connotes bearish pressure. The three exponential moving averages are fanned apart which mean strength in the trend and in this context the downtrend. The daily candle opened bearish below the moving averages crossover at $0.2414 against yesterday’s opening of $0.2480. This shows that more sellers are in the market to further push the price southward. The Stochastic Oscillator is in the oversold region with its signal pointing up. This means that a slight bullish pressure might occur but this is a retracement for the downward trend continuation. Most likely, the bears seemed to be determined to push the price to the $0.2000 demand zone in the medium-term.
ADAUSD Short-term Trend: Bearish
Cardano goes bearish in the short-term. The bears’ supremacy over the bulls was once again demonstrated as the price breaks down from the range. The strong bearish momentum led to the breaking of the $0.2400 lower demand zone of yesterday’s ranging market. The price was pushed down to the $0.2300 fresh demand area, forming lower highs and lower lows. This is synonymous with a bearish market. A retest of the $0.2400 new supply area is likely. This will most probably justify the sellers’ opportunity for another ride southward.
The views and opinions expressed here do not reflect that of CryptoGlobe.com and do not constitute financial advice. Always do your own research


