
ADAUSD Long-term Trend -Bearish
Supply zone: $0.3600, $0.3800, $0.4000
Demand zone: $0.2000, $0.1800, $0.1600
Cardano’s long-term outlook is bearish. The chart clearly shows price crossed below the three EMAs, which implies bearish pressure downward. The journey to the south started on May 3 with the formation of two bearish hammers. The bulls’ efforts to push the price up were rejected with the formation of another bearish inverted hammer and then three long bearish engulfing candles.
Each bearish engulfing candle broke past the support of the 12, 26 and 50-day EMA. The bearish pressure was so strong that it pushed the price down and broke critical demand zones at $0.3500, $3000 and $0.2500 in style.
.
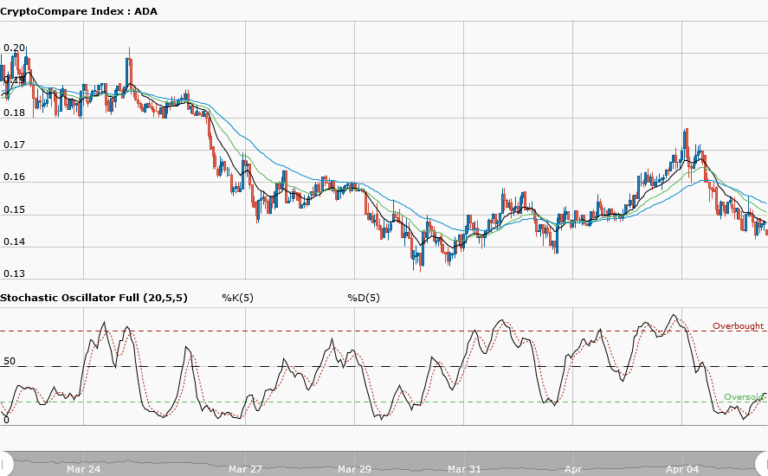
Cardano’s southward journey is already ongoing as bullish momentum has been gradually fading. A pullback to the $0.3000 supply area may likely occur in the coming week. This is probable as we can see that the Stochastic Oscillator is in the oversold region and may likely turn its signal up for upward momentum. This, to give a nice right shoulder to the overall head and shoulders pattern Cardano is forming in the long-term scenario. This may occur before the likely final drop to the $0.2000 demand zone.
The views and opinions expressed here do not reflect that of CryptoGlobe.com and do not constitute financial advice. Always do your own research.


