

BTCUSD Medium-term Trend: Bearish
Resistance: $9,300, $9,200, $9,100
Support: $8,700, $8,800, $8,900
BTCUSD has held above the psychological level of $9,000 where it has been stable for some time. However, from the weekly chart, a downtrend has been established. A bearish trend line has been drawn showing the resistance levels where traders can place their short trades. Traders can trade along the bearish trend line. That is, as price of Bitcoin is falling, a time will come when price will pull back to touch the trend line. At that point, a resistance level has been created. Then you can place a short trade assuming the appropriate risk management is in place.
This setup will come up again and again as long as the downtrend lasts. If price breaks the support level at $9,000, Bitcoin will likely find support at $8,500.
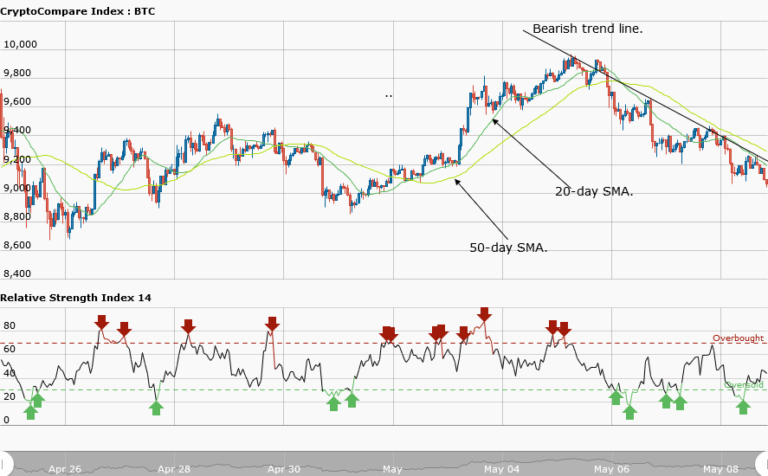
BTCUSD Short-term Trend: Bearish

In the daily chart, price of Bitcoin is in a smooth downtrend. A bearish trend line has been drawn on the chart showing the resistance levels of price where traders can place their short trades. At a price of $9,400, Bitcoin fell to the low of $9,048.
The views and opinions expressed here do not reflect that of CryptoGlobe.com and do not constitute financial advice. Always do your own research.


