

BTCUSD Medium-term Trend: Ranging
Resistance: $9,550, $9,500, $9,450
Support: $9,250, $9,300, $9,350
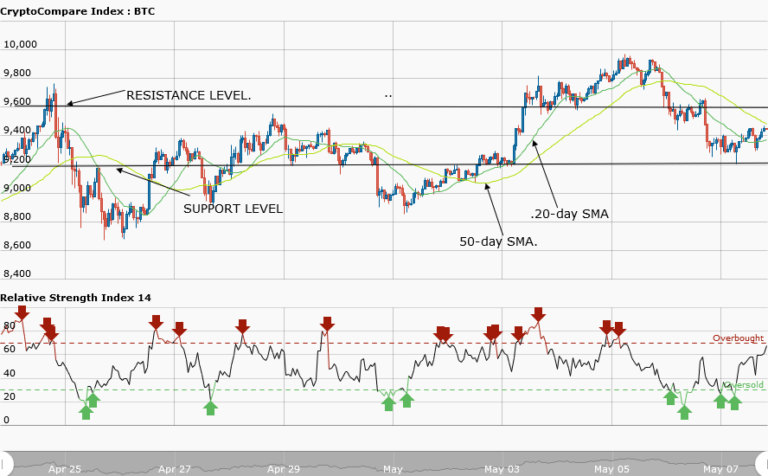
Yesterday, March 7, the BTCUSD pair reached the high of $9,963 but was resisted by the Bears who brought the price to the low of $9,310.74. The Bulls sustained their hold on the bitcoin price because the $9,000 mark had been a psychological price level. Therefore, as long as the asset remains above that level – the outlook will remain bullish. Bitcoin is currently trading at $9,417.36 as of the time of writing.
However the price of Bitcoin has remained the same after the fall from the high of $9,963. The pair is currently moving in a range bound movement. Today, the price of Bitcoin may continue its range bound movement but if it falls from its psychological level it will find support at $8,500. The relative strength index period 14 is level 60 which indicates that the price is in the bullish trend zone.
BTCUSD Short-term Trend: Ranging

The BTCUSD pair is also ranging on the daily chart. At the support of $9,350 and $9,300, the price of Bitcoin was ranging horizontally, later it had a bullish movement to the high of $9,450. From that same high of $9,450, the price fell to the support of $9,300. The range bound movement is ongoing between the levels of $9,300 and $9,450.
The views and opinions expressed here do not reflect that of CryptoGlobe.com and do not constitute financial advice. Always do your own research.


