

BTCUSD Medium-term Trend: Bearish
Resistance: $9,600, $9,500, $9,400
Support: $9,000, $9,100, $9,200
Last week, the BTCUSD pair was trading within the price range of $9,000 and $9,600. The price of the asset maintained its psychological level of $9,000 throughout the week. Last week we also saw Bitcoin breaking the resistance level at $9,500 which has been range bound since April 24, 2018. We will see if Bitcoin will sustain that price level or fall back to the range bound zone.
Today, the BTCUSD pair is trading at $9,310.75 as at the time of writing. However, from the weekly chart, on May 5, the price of Bitcoin reached the high of $9,963 and was resisted by the bears. The bears took the price to the low of $9,504 and commenced a range bound movement. Today, the asset has fallen again to the low of $9,310.75. The BTCUSD pair has come back to its psychological price level of $9,000 .
As long as the asset remains above this level the outlook is bullish. I do not see price falling below the support level of $9,000 but the pair may move in a range bound movement above that level.
BTCUSD Short-term Trend: Bearish

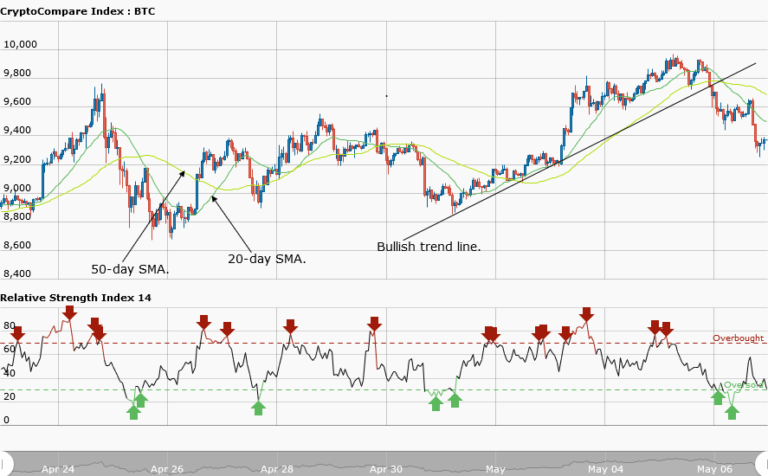
On the daily chart, price of Bitcoin reached the high of $9,700 and was resisted by the bears who compelled it to move in a range bound movement. The BTCUSD pair fell again and found support at $9,300.Price of Bitcoin is expected to rise to repeat and surpass the events of last week.
The views and opinions expressed here do not reflect that of CryptoGlobe.com and do not constitute financial advice. Always do your own research.


