

BTCUSD Medium-term Trend: Bullish
Resistance: $10,000, $9,900, $9,800
Support: $9,300, $9,400, $9,500
Yesterday, May 3, Bitcoin was in its third day without any significant medium term trend forming. Though, traders were advised to hold their trades above the psychological level at $9,000. In addition, they were to put their stop loss below the support level at $8,500 because, if Bitcoin falls it will likely find support at $8,700. Today, the BTCUSD pair is trading at $9,745.46 as at the time of writing.
However, from the weekly chart, price of Bitcoin has broken the resistance level at $9,500. It has moved out of the range-bound zone. With this breakout, Bitcoin is expected to rally at the resistance level at $10,500 price level. We are to move our stop loss from $8,500 to the psychological level of $9,000. Also, we can take partial profits or trail stops our positions
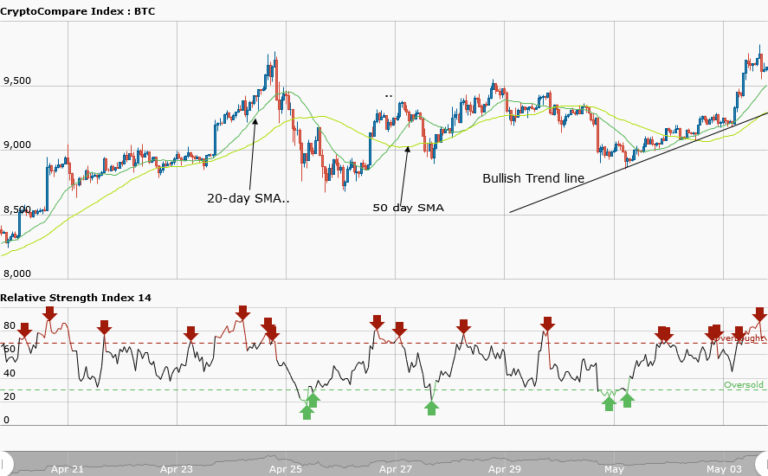
BTCUSD Short-term Trend: Bullish

The BTCUSD pair is in a bullish trend on the daily chart. At the support of $9,200, the asset was in a range bound movement until it had a bullish movement to the high of $9,700. At that level, price pulled back and resume a range bound movement. Meanwhile, relative strength index period 14 is level 50 which indicates that price is in the range bound zone.
The views and opinions expressed here do not reflect that of CryptoGlobe.com and do not constitute financial advice. Always do your own research.


