

BTCUSD Medium-term Trend: Bearish
Resistance: $7,900, $7,800, $7,700
Support: $7,300, $7,400, $7,500
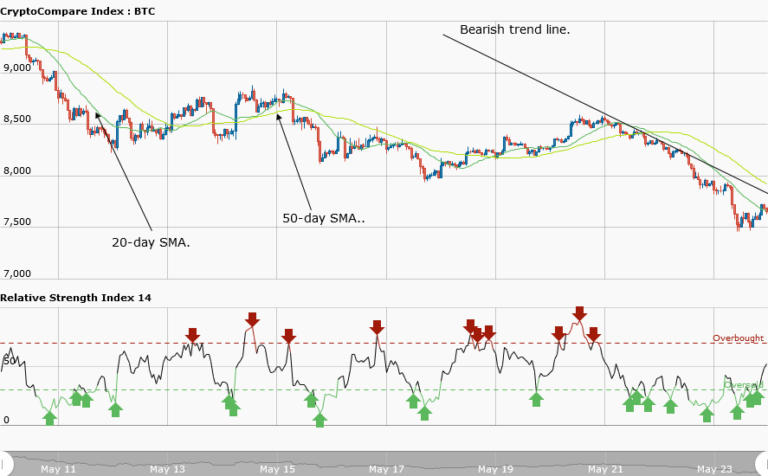
Yesterday, May 23, price of Bitcoin broke the support level at $8,000. It was assumed yesterday that if the downtrend continued, the asset could fall to lows of $7,000 and $6,600. However, the price of Bitcoin is currently trading at $7,495.72. Bitcoin’s price has fallen to a low of $7,500. On the weekly chart, the bears have been resisted at the $7,500 level twice.
In order to know when the decline will end, a bearish trend line can be drawn across the price bars at the resistance levels. If Bitcoin breaks the trend line and the candlestick closes on the opposite side of the trend line, then we will assume that the decline has ended. However, traders should wait for the decline to end before embarking on long positions.
On the other hand, if the downtrend continues, price of the asset is expected to fall to the lows of $7,000 or $6,600.
BTCUSD Short-term Trend: Bearish

On the daily chart, price of Bitcoin is still in a bearish trend. Price of the asset was ranging between the levels of $7,900 and $7,800 before it fell to the low of $7,500. The asset has tested the support level at $7,500 on more than three occasions and was repelled. The asset is currently in a range bound movement after testing the support level at $7,500.
The views and opinions expressed here do not reflect that of CryptoGlobe.com and do not constitute financial advice. Always do your own research.


