

BTCUSD Medium-term Trend: Bearish
Resistance: $8,200, $8,100, $8,000
Support: $7,600, $7,700, $7,800
Yesterday, May 22nd the bprice of Bitcoin could not break the resistance level at $8,500 and the asset fell and went into a range bound movement. The assumption was that if the price continued its fall and the support level at $8,000 was broken, the asset would decline to the lows of $7,000 or $6,600. But if the bulls held on to the price, the asset would continue its range bound movement.
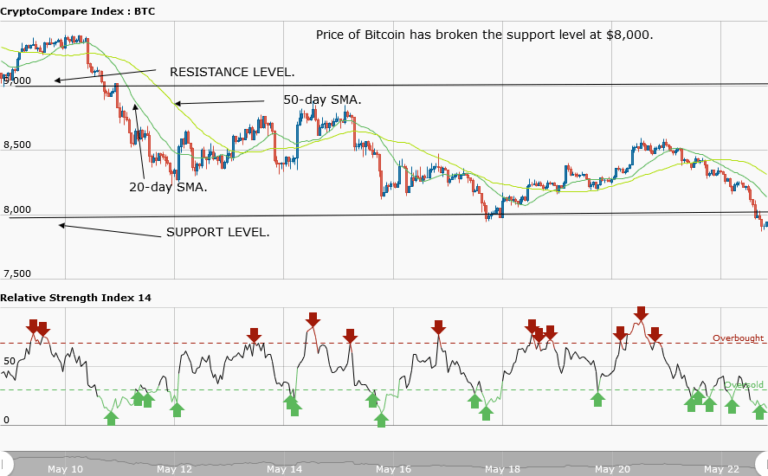
Today, Bitcoin is currently trading at $7,916.08 at the time of writing. However, from the weekly chart, the price of Bitcoin has broken the support level at $8,000. The fall in price of Bitcoin had been systematic when viewed from the time the asset reached the high of $10,000. The price of Bitcoin reached the high of $10,000 mark on May 6, 2018.
On May 11, the price fell to the low of $8330. Also, on May 15th and May 17th, the price of the asset had fallen to the lows of $8,163 and $7,968 respectively. Today – as at the time of writing, the asset has fallen to the low of $7,916.08. If the downtrend continues, the price of Bitcoin is likely to fall to the lows of $7,000 and $6,600.
BTCUSD Short-term Trend: Bearish

On the daily chart, the price of Bitcoin is in a smooth downtrend. From the daily chart, the asset has fallen to the low of $7,900. The 20-day moving average and the 50-day moving average are trending southward.
The views and opinions expressed here do not reflect that of CryptoGlobe.com and do not constitute financial advice. Always do your own research.


