

BTCUSD Medium-term Trend: Bearish
Resistance: $8,450, $8,400, $8,350
Support: $8,150, $8,200, $8,250
Yesterday, May 21st, th price of Bitcoin was trading above the $8,000 price level. The asset faced resistance at a price of $8500 and the assumption was that if the bulls could break the price at $8,500, the price would reach the highs of $9,000 and above. Today, the price of Bitcoin is trading at $ 8,328.69 as at the time of writing.
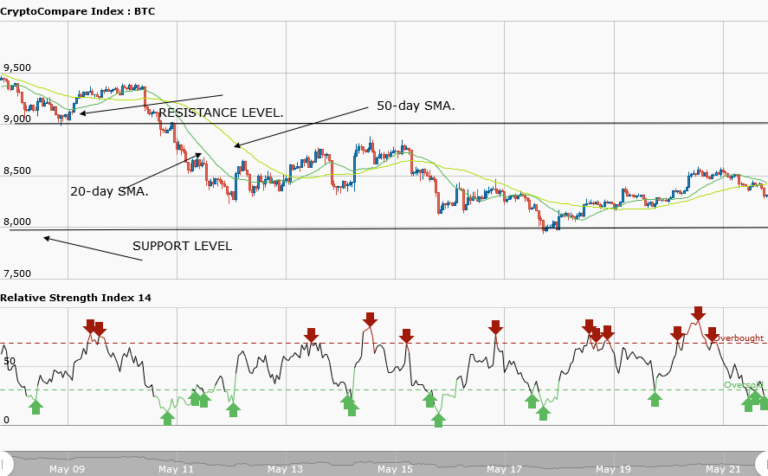
From the weekly chart, the price of Bitcoin failed to break the initial resistance at $8,500 and the asset was compelled to fall and move in a range bound movement. On May 12th, the price of Bitcoin fell from the high of $9,369 to the low of $8,387 and the price levels of $9,000 and $8,000 were created as the range bound zone of the asset. In the first week, the asset was ranging above the $8,500 price level but could not break the resistance level at $9,000.
In the second week the asset was ranging below the $8,500 price level but unable to break the resistance level at $8,500. However, the price may continue its range bound movement if the bulls fail to break the resistance level at $8,500. Conversely, the asset may fall to the lows of $7,000 and $6,685, if the bears break the support level at $8,000.
BTCUSD Short-term Trend: Bearish

On the daily chart, the price of Bitcoin fell from the high $8,500 to $8,300. At the resistance level of $8,500, the asset was ranging and then fell to the low of $8,300. The asset has resumed its range bound movement.
The views and opinions expressed here do not reflect that of CryptoGlobe.com and do not constitute financial advice. Always do your own research.


