

BTCUSD Medium-term Trend: Bearish
Resistance: $8,300, $8,200, $8,100
Support: $7,700, $7,800, $7,900
Yesterday, May 17, the BTCUSD pair was range-bound between the support level at $8,000 and the resistance level at $9,000. For the past four days, the asset has been stable in this region. Yesterday, it was assumed that if the price broke the support level, Bitcoin would fall to either $7,000 or $6,685 lows. On the other hand, if the bulls are in control, the price will break the resistance at $9,000 and reach other highs.
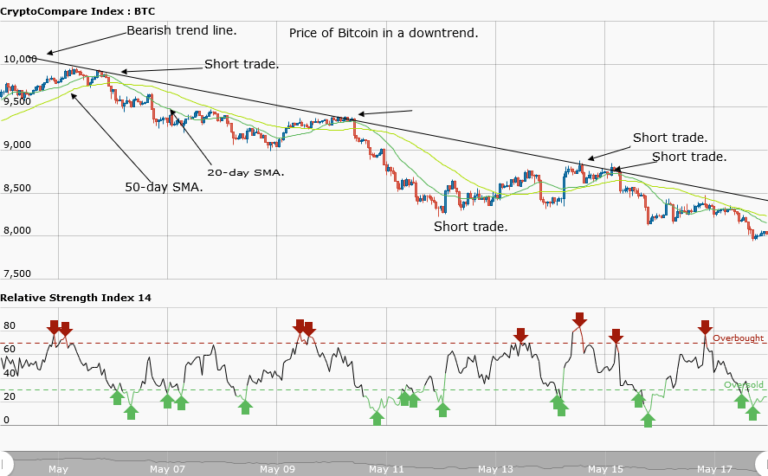
Bitcoin is trading at $8,015.50 at the time of writing. Nevertheless, the weekly chart shows the price in a smooth downtrend. A bearish trend line is drawn and it has the following content: firstly, it has pointed arrows showing the resistance levels where you can place your short trades. You can put your stop loss above the trend line; secondly, you can see the price touching the trend line as it pulls back.
In a downtrend, the price makes a series of lower highs and lower lows. If the price retraces from the recent low, a resistance level would be created, thus giving traders the opportunity to short their trades. However, if the price breaks the support level at $8,000, Bitcoin will fall to $7000. But if that level holds, the asset will continue with its range bound movement.
BTCUSD Short-term Trend: Bearish

At $8,300, Bitcoin was ranging before it fell to $8,000. At the support level, the asset resumed its range bound movement.
The views and opinions expressed here do not reflect that of CryptoGlobe.com and do not constitute financial advice. Always do your own research.


