

BTCUSD Medium-term Trend: Ranging
Resistance: $8,500, $8,450, $8,400
Support: $8,200, $8,250, $8,300
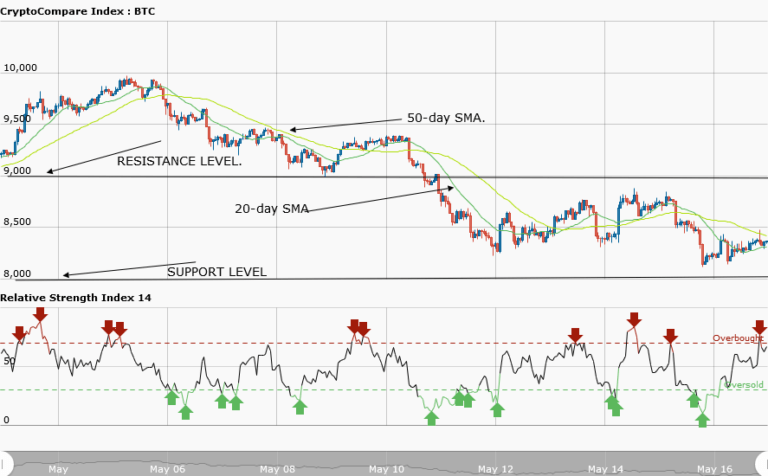
On May 14, the BTCUSD pair fell at the support level of $8,500; and the asset corrected itself by trading above it. Yesterday, May 16, the Bitcoin price fell again below the $8,500 support level. It was assumed that if the downtrend continued, the asset might find support at $8,000. Today, Bitcoin price is trading at $ 8,336.49 at the time of writing. However, the price found support below the $8,500 price mark.
The BTCUSD pair is now range-bound between the support level at $8,000 and the resistance level at $9,000. The asset price was trading in this zone since May 11. Each time the price falls below the $8,500 level, it will immediately trade back above it. However, for the past three days, the price of the asset has been stable in this region.
Nevertheless, if the asset price breaks the support level at $8,000, Bitcoin will fall to either $7000 or $6,685. However, if the bulls are in control of the price, there is a tendency for the price to return above the $8,500 level and reach other highs.
BTCUSD Short-term Trend: Ranging

On the daily chart, the Bitcoin price is in a range-bound movement. The ranging market has a choppy price action. It is not evenly apart from the resistance level and support level. It is ranging horizontally which is not a good setup for trading.
The views and opinions expressed here do not reflect that of CryptoGlobe.com and do not constitute financial advice. Always do your own research.


