

BTCUSD Medium-term Trend: Bearish
Resistance: $9,000, $8,900, $8,800
Support: $8,400, $8,500, $8,600
Yesterday May 14th, the price of Bitcoin fell below the support level at $8,500. It was assumed that the price of Bitcoin might fall to the low of $8,000. This was because it had earlier fallen to the low of $8,299 on May 12th, but the price had a bullish movement and it returned above the $8,500 price level. It was at the high of $8,727 that the price fell and broke the support level at $8,500. Today, Bitcoin is currently trading at $8,712.80 as at the time of writing.
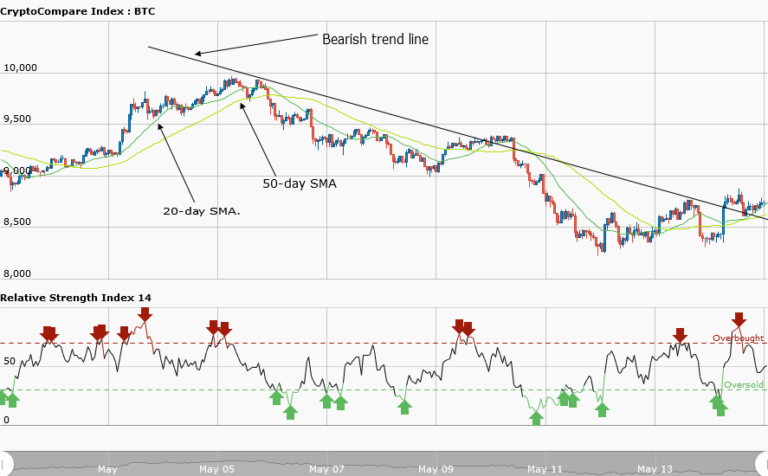
From the weekly chart, the price of Bitcoin is now trading above the $8,500 level after yesterday’s fall. The price of Bitcoin has broken the bearish trend line and the candlestick closed on the opposite of the trend line. The implication is that the downtrend is over and it is unlikely the price will continue its downtrend.
The relative strength index period 14 is level 67 indicating that the price of Bitcoin is in the bullish trend zone. The price of the asset is expected to test the resistance level at $9,000.
BTCUSD Short-term Trend: Ranging

On the daily chart, the price of Bitcoin is in a ranging market. The price of the asset was ranging at the support level of $8,400. It was at this price level that it had a bullish breakout that broke the resistance level at $8,500 . The price then soared up to the high of $8,873. It was the resistance at $8,873 that brought the price to its current level.
The views and opinions expressed here do not reflect that of CryptoGlobe.com and do not constitute financial advice. Always do your own research.


