

BTCUSD Medium-term Trend: Bearish
Resistance: $8,700, $8,600, $8,500
Support: $8,100, $8,200, $8,300
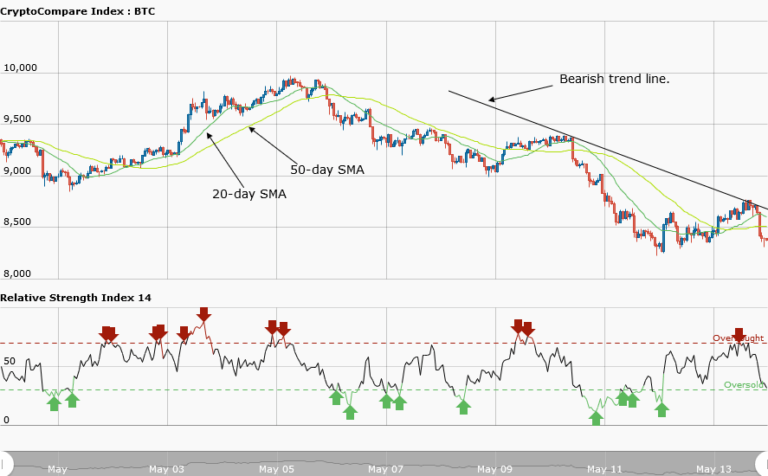
Last week, the BTCUSD pair was either bullish or bearish, but it was trading above the psychological price level of $9,000. However, Last Friday the psychological price level was broken. The price fell below the support level at $9,000 and if the asset continues its fall, Bitcoin will reach the low of $8,500. However, the relative strength index period 14 indicated that the asset was oversold suggesting Bulls will take control of the market.
If the Bulls take control of the asset, the price will return back to the psychological price level. Meanwhile, Bitcoin is currently trading at $8,375.15 as at the time of writing. Nevertheless, from the weekly chart, the price of Bitcoin fell to the low of $8,299 on May 12, and the price made a pullback. The asset is currently trading below the $8,500 level.
If the asset continues its fall, price of Bitcoin will find support at $8,000.
BTCUSD Short-term Trend: Ranging

On the daily chart, price of Bitcoin is in a ranging market. The price had earlier fallen to the low of $8,400 and commenced a range bound movement. Later it made a bullish movement to the high of $ 8,700. However; the asset traded in a range bound movement between the levels of $8,700 and $8,600 and later fell to the low of $8,330.
The views and opinions expressed here do not reflect that of CryptoGlobe.com and do not constitute financial advice. Always do your own research.


