

BTCUSD Medium-term Trend: Bearish
Resistance: $9,300, $9,200, $9,100
Support: $8,500, $8,700, $8,600
Yesterday, March 10, price of Bitcoin has broken the bearish trend line indicating that the downtrend is over. However, from the weekly chart, price of Bitcoin has made a sudden fall below the psychological level of $9,000.
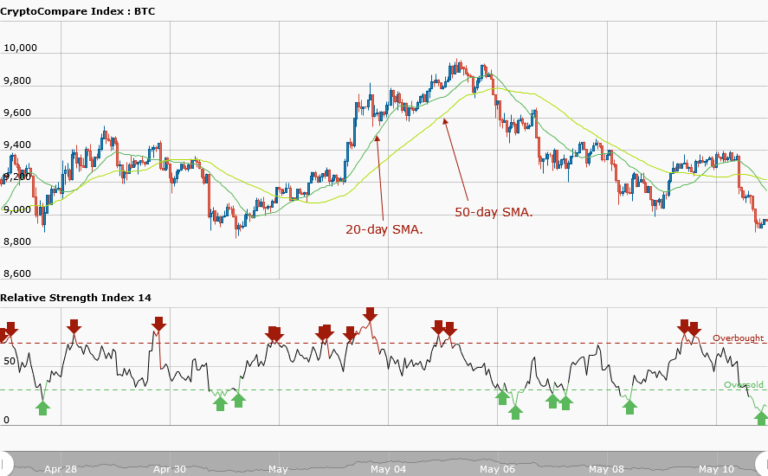
On May 6, the asset was trying to reach the high of $10,000 and was resisted at a price of $9,667 and it fell to the low of $9,361. The asset had been trading above that psychological level of price above $9,000. In the other words, the asset had been trading above the support level at $9,000 for the past five days. However, if price of the asset continues with its fall, Bitcoin will further decline to the low of $8,500.
Nevertheless, the relative strength index period 14 is Level 12 which indicates that the market is oversold suggesting Bulls to take control of the market. If the Bulls take control of the market, price of Bitcoin will resume trading at the psychological level of price.
BTCUSD Short-term Trend: Bearish

In the daily chart, price of Bitcoin has a bearish outlook. The price of the asset was ranging at the resistance level of $9,300 before it fell to the low of $8,900.
The views and opinions expressed here do not reflect that of CryptoGlobe.com and do not constitute financial advice. Always do your own research.


