

BTCUSD Medium-term Trend: Bullish
Resistance: $9,500, $9,450, $9,400
Support: $9,150, $9,200, $9,250
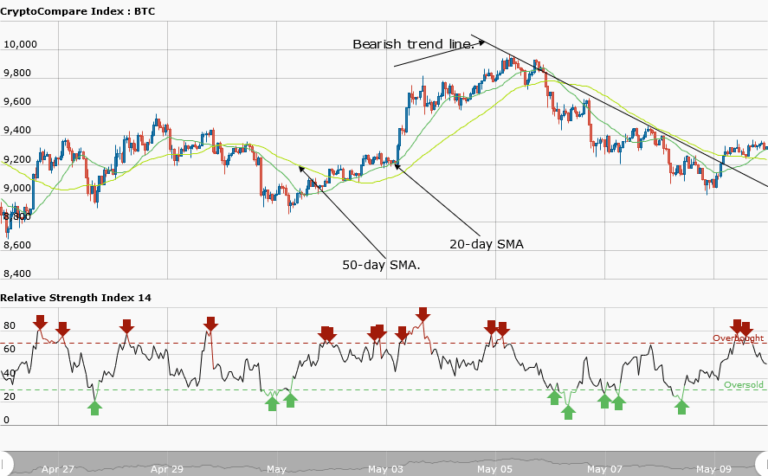
Yesterday, March 9, the BTCUSD pair was in a downtrend and a bearish trend line was drawn to show the resistance levels where traders could short their trades. However, the Bulls have resisted price from breaking the support level at $9,000. Presently, price of Bitcoin is trading at $9,324.77 as at the time of writing. From the weekly chart, price of Bitcoin has broken the bearish trend line indicating that the downtrend is over. Price of Bitcoin has been stable above the psychological level of $9,000 and it is poised to retest the resistance level of $9,963.
Meanwhile, the relative strength index period 14 is level 53 which indicates that price is in the range bound zone.
BTCUSD Short-term Trend: Bullish

In the daily chart, price of Bitcoin has commenced a bullish trend. A bullish trend line is drawn to show the support levels where traders can place their long trades. In an uptrend, price will make a series of higher highs and higher lows. For that reason, you may wish to buy low at support and sell high in the upper bounds of the trend channel.
The views and opinions expressed here do not reflect that of CryptoGlobe.com and do not constitute financial advice. Always do your own research.


