

BTCUSD Medium-term Trend: Ranging
Resistance: $9,300, $9,200, $9,100
Support: $8,700, $8,800, $8,900
Yesterday, April 30, the BTCUSD pair was in a bullish market and it was trading above the $9,000 mark. Price of Bitcoin was making frantic effort to reach the high of $10,000. Yesterday, traders were advised that as the bullish market is ongoing they can place long orders along with the trend line. That is if price pulls back and touches the trend line, a support level is created where they can place their long trades.
Price of Bitcoin is currently trading at $9,000.65 as at the time of writing.Today, price of the asset has found support above the $9,000 price level. Bitcoin also found resistance at the $9,500 level. On April 25, price of Bitcoin broke the support level at $9,000, and the asset had since been fluctuating between the levels of $9,000 and the $9,500.
Therefore, if the bears break the support level, price of Bitcoin will further decline to the low of $ 8,500. On the other hand, if the bulls break the critical resistance level at $9,500, then we should expect Bitcoin to reach the high of $10,000.
BTCUSD Short-term Trend: Bearish

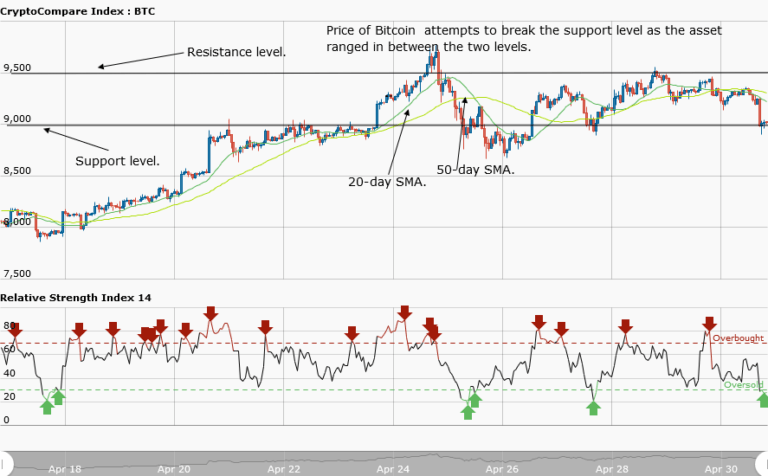
In the daily Chart, price of Bitcoin is falling and attempting to break the support level of price. The asset was in a range bound movement along the $9,300 price level but later fell to the low of $9,000 to continue its ranged bound movement.
The views and opinions expressed here do not reflect that of CryptoGlobe.com and do not constitute financial advice. Always do your own research.


