

ZECUSD Medium-term Trend: Bearish
Supply levels: $295, $290, $285
Demand levels: $265, $270, $275
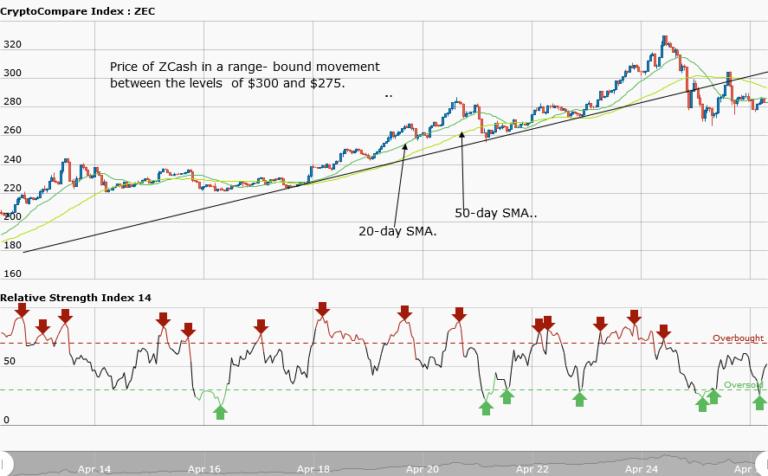
ZCash price fell from the resistance at $320 to the low of $275 . The bearish outlook has been confirmed by the moving averages. When price fell to the low of $275 , there was no further price decline; rather the asset was fluctuating between the support level at $275 and the resistance level at $300. Price of ZCash has been fluctuating for the past three days between the $300 and $275 levels.
There is a possibility of a breakout in the days to come. However, if price breaks the support level at $275, it will further decline to the low of $260 . On the other hand, if price breaks the resistance level at $300, then price will rise to the $400 level.
ZECUSD Short-term Trend: Ranging

The daily chart shows price in a range bound market. At the $275 support level, ZCash rose to $305 and fell again to $ 275. Then the price began a range bound movement. However, this is not a perfect setup because the price of the asset is not evenly apart between the resistance level and the support level.
The views and opinions expressed here do not reflect that of CryptoGlobe.com and do not constitute financial advice. Always do your own research.


