

ZECUSD Medium-term Trend: Ranging
Supply levels: $270, $260, $250
Demand levels: $210, $220, $230
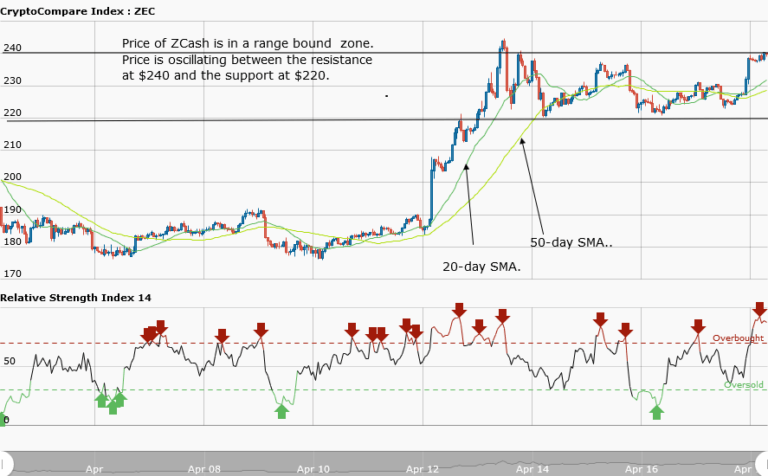
ZCash price is currently trading at $236.54. For about a week, the price oscillated between the resistance at $240 and the support at $220. The bulls have tried without success to break the resistance at $240, same as the bears have tried with the support level.
Whatever the case may be, a breakout is imminent. Meanwhile, the RSI period 14 is level 87, which indicates that the market is seriously overbought, suggesting bears will take control of the market. However, from the price action, the bulls are likely to break the resistance level at $240.
ZECUSD Short-term Trend: Ranging

In the daily chart, the ZCash price has no directional movement. It was moving horizontally at $230, before falling to $225. It was also moving horizontally at every price levels. In the daily chart, the RSI period 14 is level 31 which indicates that the market is oversold, suggesting bulls will take control of the market.
The views and opinions expressed here do not reflect that of CryptoGlobe.com and do not constitute financial advice. Always do your own research..


