

ZECUSD Medium-term Trend: Ranging
Supply levels: $220, $215, $210
Demand levels: $190, $195, $200
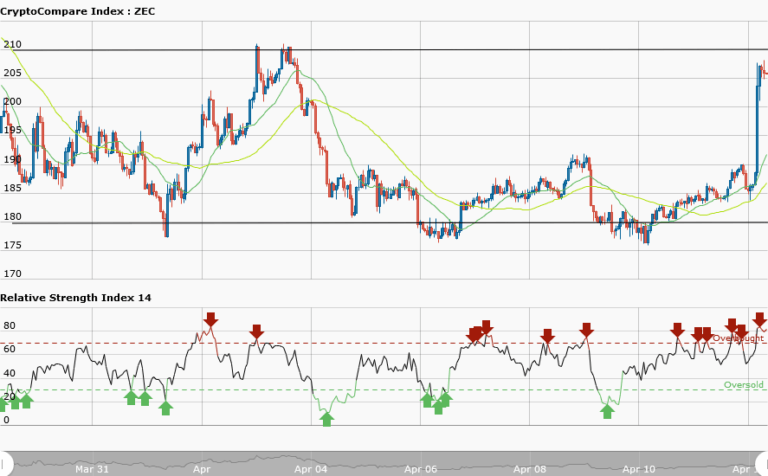
Yesterday, ZCash was predicted to rise and test the resistance level. Also, the RSI indicator diverges with the price action and what we can take from the divergence is that the price reversal is imminent in ZCash. Today, ZCash is trading at $205.01 against $185.19 yesterday. In the weekly chart, the price of the asset has reached the resistance level at $205.01.
However, from the RSI period 14 is level 79, which indicates that the market is overbought, suggesting bears to take control of the market. If this happens, then the price of the asset will fall to its previous low of $185.19. But if the bulls continue to push price forward, they may break the resistance level at $210.
ZECUSD Short-term Trend: Ranging

In the daily chart, ZCash price is ranging in a horizontal pattern at $185 before it rose to the level at $205.01. ZCash price has commenced a range bound movement as the asset reached the market price of $205.
The views and opinions expressed here do not reflect that of CryptoGlobe.com and do not constitute financial advice. Always do your own research.


