

XRPUSD Medium-term Trend: Ranging
Supply Levels: $0.51, $0.50, $0.49
Demand levels: $0.45, $0.55, $0.60
Last week, the price of Ripple traded similar to the other assets. On April 4, XRPUSD pair traded up to $0.53 in a bullish trend. However, within 24 hours, the bulls lost possession to the bears who took price to its low at $0.46. Today, price of Ripple is trading at $0.47. From the weekly chart, price of Ripple is in a range bound movement. The 20-day moving average and 50-day moving average are trending in a range bound movement.
Price of Ripple may continue its range bound movement this week as it had been since the beginning of this month.
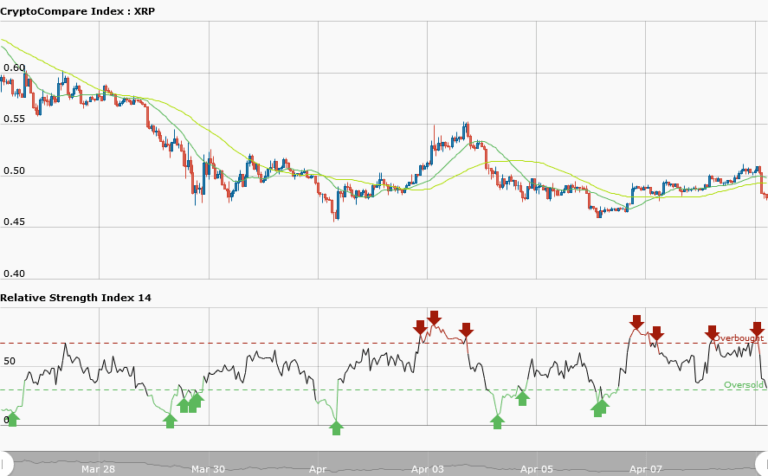
XRPUSD Short-term Trend: Ranging

The XRPUSD pair is ranging at a price of $0.49 but rose to $0.51 to continue its range bound movement, before it finally falls to its present low at $0,47. However, RSI period 14 is level 35 which indicates that the market is oversold suggesting bulls to take over the market. Since the market is ranging, traders can take advantage of using a range bound strategy to trade.
For instance, as the market is oversold, you should look for a buy setup where you can place a long trade. Thereafter you can exit your position at the next resistance zone.
The views and opinions expressed here do not reflect that of CryptoGlobe.com and do not constitute financial advice. Always do your own research


