

XRPUSD Medium-term Trend: Bullish
Supply Levels: $0.86, $0.85, $ 0.84
Demand levels: $0.80, $0.81, $0.82
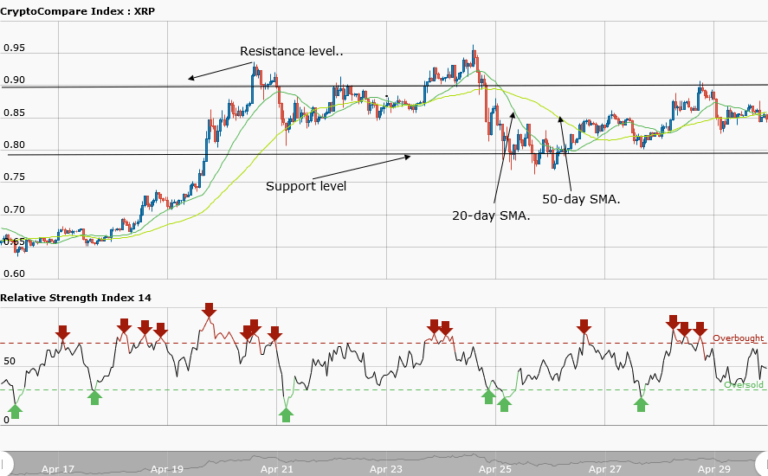
Last week, Ripple price was in a bullish market. The asset traded up to $0.92 before it was resisted by the bears. This made price fall to $0.80. The XRPUSD pair also went into a range bound movement between the $0.77 and $0.84 levels. The asset was trading at $0.84 at the time of writing.
However, Ripple price is in a range-bound movement after the pullback from $0.92. After it fell to $0.77, it entered the range-bound levels at $0.90 and $0.80. The price made an attempt tp break the resistance level at $0.90 but failed. However, if it breaks the resistance level at $0.90, a long trade should be initiated.
On the other hand, if the price breaks the support level at $0.80, a short trade can be placed. The relative strength index period 14 is level 49, which indicates that the price is in a range bound zone.
XRPUSD Short-term Trend: Ranging

The daily chart shows the price in a ranging market. The price action is very choppy and tarders usually refrain from trading in such market. The asset price is not evenly apart from the resistance level to the support level.
The views and opinions expressed here do not reflect that of CryptoGlobe.com and do not constitute financial advice. Always do your own research.


