

XRPUSD Medium-term Trend: Bullish
Supply Levels: $.95, $0.90, $ 0.85
Demand levels: $0.65, $0.70, $0.75
On Monday, April 23, the XRPUSD pair broke the resistance level at $0.90. The resistance is now a support level, and traders were advised to place long trades at $0.92, in anticipation of the price’s movement to the $1.00 high or because of the volatility of the asset. However, there was a price pullback from the resistance at $0.90 to $0.80.
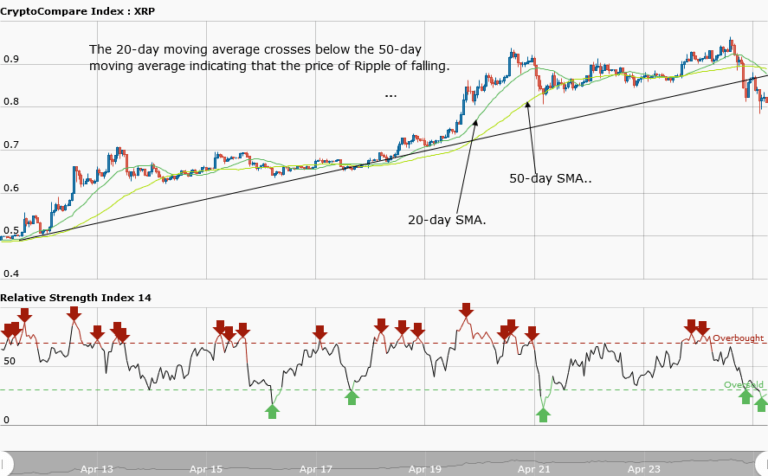
Ripple price was trading at $0.81 at the time of writing. Nevertheless, the weekly chart shows that the price broke the bullish trend line and the candlestick closed on the opposite of the trend line. The price will find support at $0.81 and move in a range bound movement. Meanwhile, the 20-day moving average crosses below the 50-day moving average is indicating that the asset’s price is falling.
XRPUSD Short-term Trend: Ranging

In the daily chart, Ripple price has traded up to the resistance level at $0.90. At this level, Ripple went into a range bound movement before the bears took the price to $0.81.
The views and opinions expressed here do not reflect that of CryptoGlobe.com and do not constitute financial advice. Always do your own research.


