

XRPUSD Medium-term Trend: Bullish
Supply Levels: $0.94, $0.93, $0.92
Demand levels: $0.88, $0.89, $0.90
Yesterday, April 23, the asset was approaching the high of $0.90. It was expected for the bulls to break the resistance at $0.90 so that price will reach the high of $1.00. Actually, the bulls made three attempts before the resistance was broken. Today, XRPUSD pair is trading at $0.92. Nevertheless, know that the price at $0.90 is no longer a resistance but a support level because the level has been broken .
Traders may wish to place long trades at a price of $0.92 and exit at the next price level. Price is expected to reach the high of $ 1.00, though the bulls may encounter another resistance at a price of $1.00. However, Ripple is a volatile cryptocurrency and as such if the price breakout of the $0.90 price level, it will reach the high of $1.00.
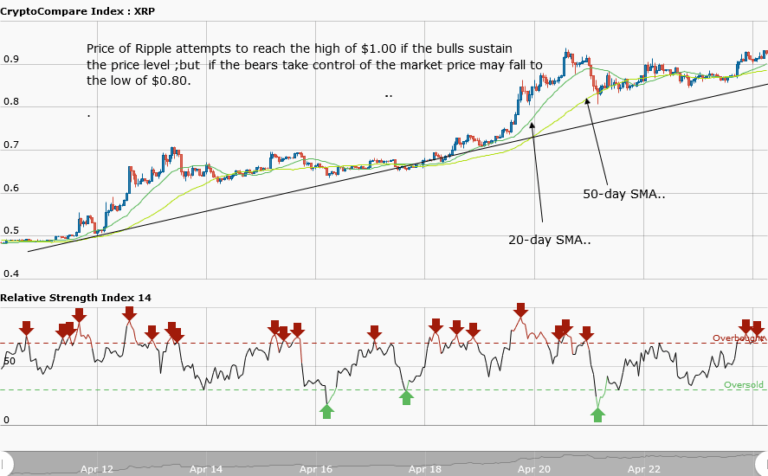
On the other hand, if it falls at a price of $0.90 it will reach the low of $0.80. However, the relative strength index period 14 is level 76 which indicates that the market is overbought suggesting bears to take control of the market.
XRPUSD Short-term Trend: Ranging

In the daily chart, price of Ripple is ranging. The asset moves in a range at the price of $0.87 and makes a bullish movement to the high of $0.92 and finally falls to the low of $0.90.
The views and opinions expressed here do not reflect that of CryptoGlobe.com and do not constitute financial advice. Always do your own research


