

XRPUSD Medium-term Trend: Bullish
Supply Levels: $0.90., $0.89, $0.88
Demand levels: $0.84, $0.85, $0.86
Last week, the XRPUSD pair was in a bullish market in some of the days. The price has also been ranged bound for over two weeks between the resistance level at $0.50 and the support level at $0.46. During last week analyses, the resistance level at $0.50 was broken and the price rose to the $0.70 high. The bulls encountered resistance at $0.70 before it was broken again. Today, Ripple is currently trading at $0.87.
However, in the weekly chart, the price is approaching the resistance level at $0.90. This was formally a strong support level that was broken by the bears in March this year. The bulls may have difficulty in breaking this level at this time. The price has reached the $0.90 level and bounced back to the $0.80 low. Meanwhile, if the bulls break the resistance level, the price will reach the $1.00 high and another level of price.
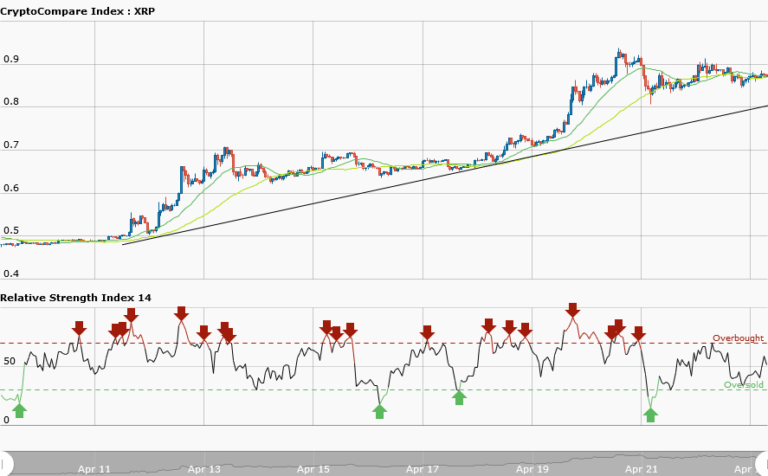
XRPUSD Short-term Trend: Ranging

In the daily chart, the Ripple price is in a range bound movement. The bullish trend had reversed to a range bound movement. At $0.85, Ripple rose to the $0.90 high and was resisted by the bears. At that price level, the market went into a range bound movement and it fell and found support at $0.85.
The views and opinions expressed here do not reflect that of CryptoGlobe.com and do not constitute financial advice. Always do your own research.


